

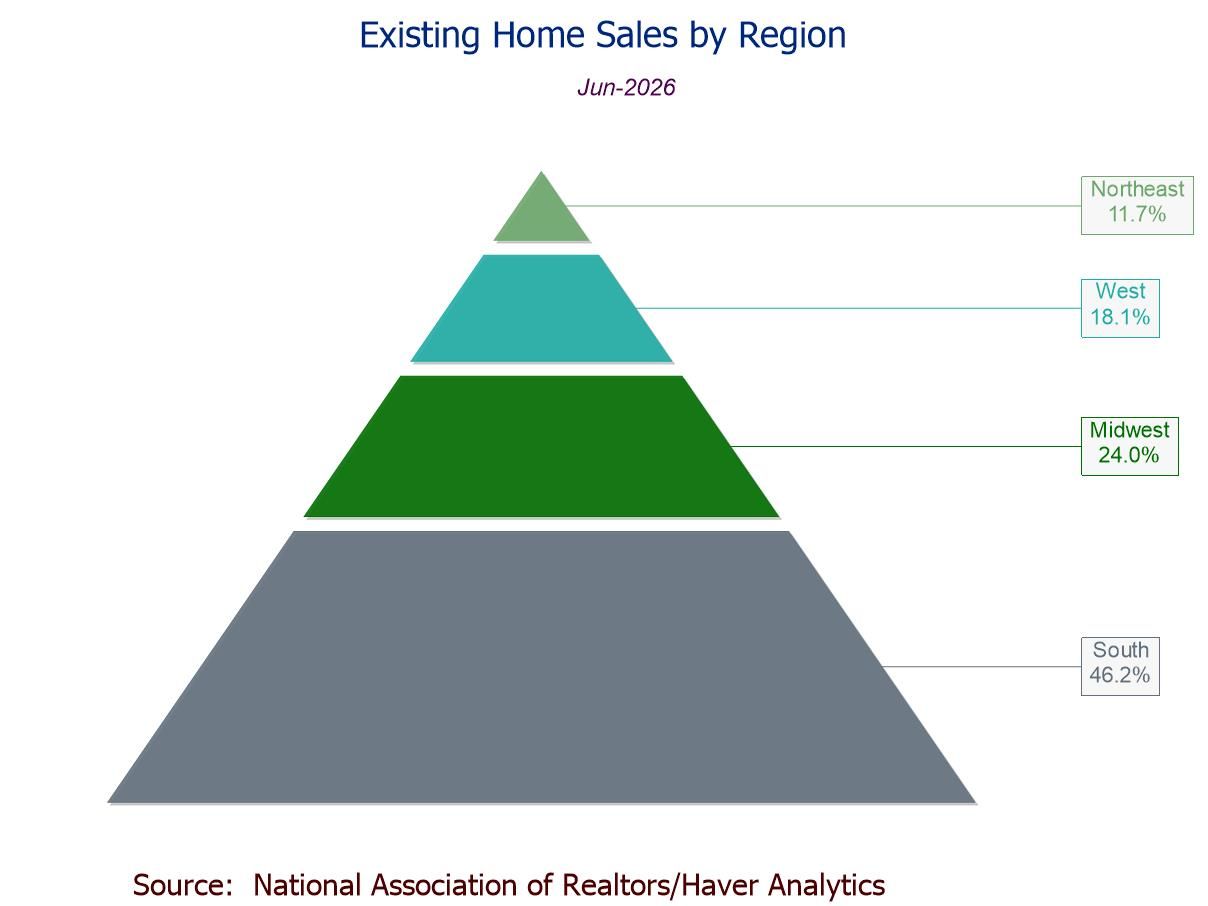
- June sales -2.4% m/m to 4.09 mil., first drop in three mths.; +2.8% y/y, third straight y/y rise.
- Sales m/m down in the South (-3.6%), Midwest (-3.0%), and West (-1.3%); up in the Northeast (+2.1%).
- Sales y/y up in all regions except the Northeast w/ a flat reading.
- Median sales price +2.2% (+1.8% y/y) to $440,600, a record high.
- Unsold inventory -0.6% (+1.3% y/y) to 1.56 mil. units, first m/m decline since Dec.; 4.6 months' supply, highest since Aug. ’25.
Introducing
Winnie Tapasanun
in:Our Authors
Winnie Tapasanun has been working for Haver Analytics since 2013. She has 20+ years of working in the financial services industry. As Vice President and Economic Analyst at Globicus International, Inc., a New York-based company specializing in macroeconomics and financial markets, Winnie oversaw the company’s business operations, managed financial and economic data, and wrote daily reports on macroeconomics and financial markets. Prior to working at Globicus, she was Investment Promotion Officer at the New York Office of the Thailand Board of Investment (BOI) where she wrote monthly reports on the U.S. economic outlook, wrote reports on the outlook of key U.S. industries, and assisted investors on doing business and investment in Thailand. Prior to joining the BOI, she was Adjunct Professor teaching International Political Economy/International Relations at the City College of New York. Prior to her teaching experience at the CCNY, Winnie successfully completed internships at the United Nations. Winnie holds an MA Degree from Long Island University, New York. She also did graduate studies at Columbia University in the City of New York and doctoral requirements at the Graduate Center of the City University of New York. Her areas of specialization are international political economy, macroeconomics, financial markets, political economy, international relations, and business development/business strategy. Her regional specialization includes, but not limited to, Southeast Asia and East Asia. Winnie is bilingual in English and Thai with competency in French. She loves to travel (~30 countries) to better understand each country’s unique economy, fascinating culture and people as well as the global economy as a whole.

Publications by Winnie Tapasanun
 USA| Jul 06 2026
U.S. ISM Services PMI Eases in June, Still Indicating Expansion for the 24th Straight Month
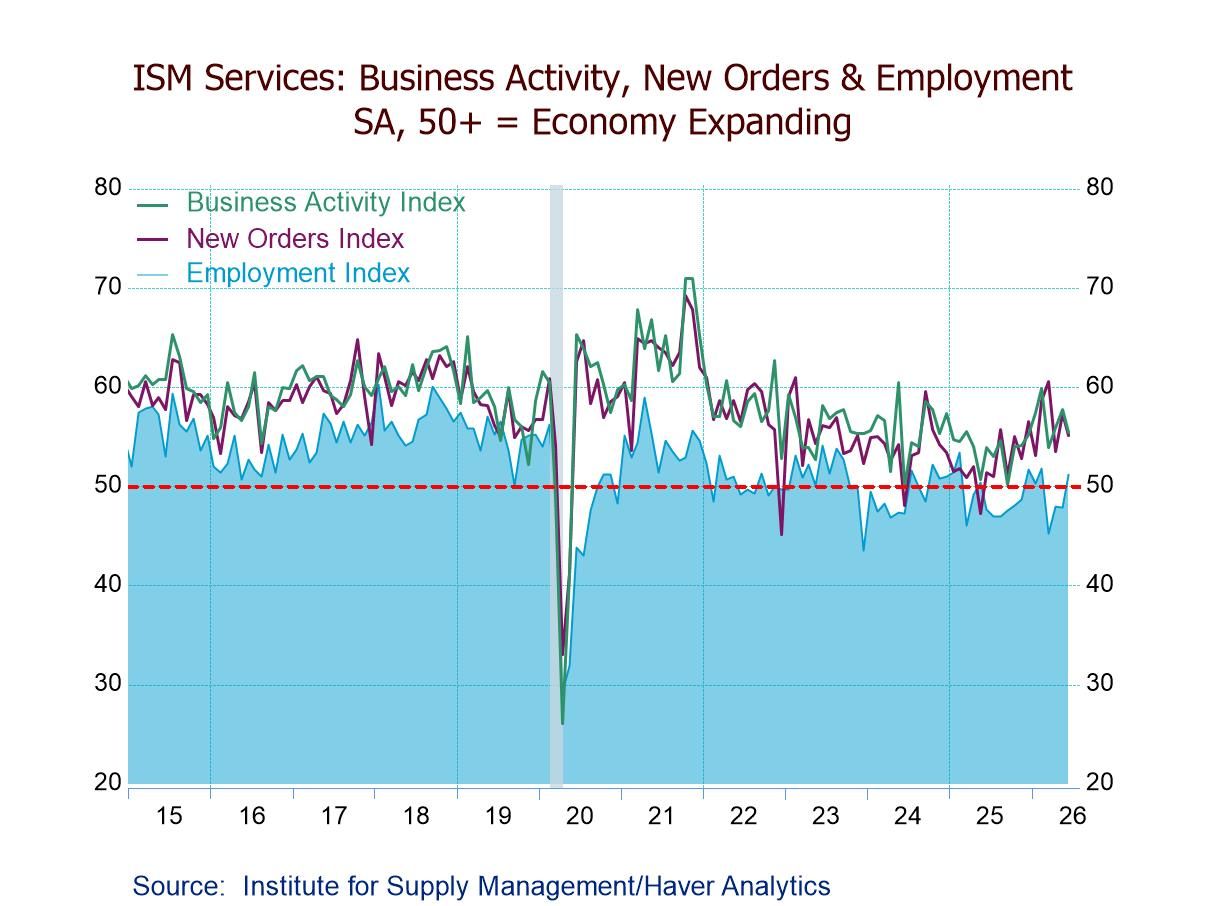
- ISM Services PMI down to 54.0 in June, remaining above the 12-month avg. of 53.1.
- Business Activity (55.4) expands for the 24th consecutive mth.; New Orders (55.1) for the 13th straight mth.; Employment (51.2, first expansion since Feb.); Supplier Deliveries (54.4 vs. 55.2).
- Prices Index (67.7) at a four-month low, still indicating prices rising since June ’17.
 USA| Jul 01 2026
U.S. ISM Manufacturing PMI Still Expansionary in June; New Orders and Production Growing at a Slower Pace; Employment Contracting
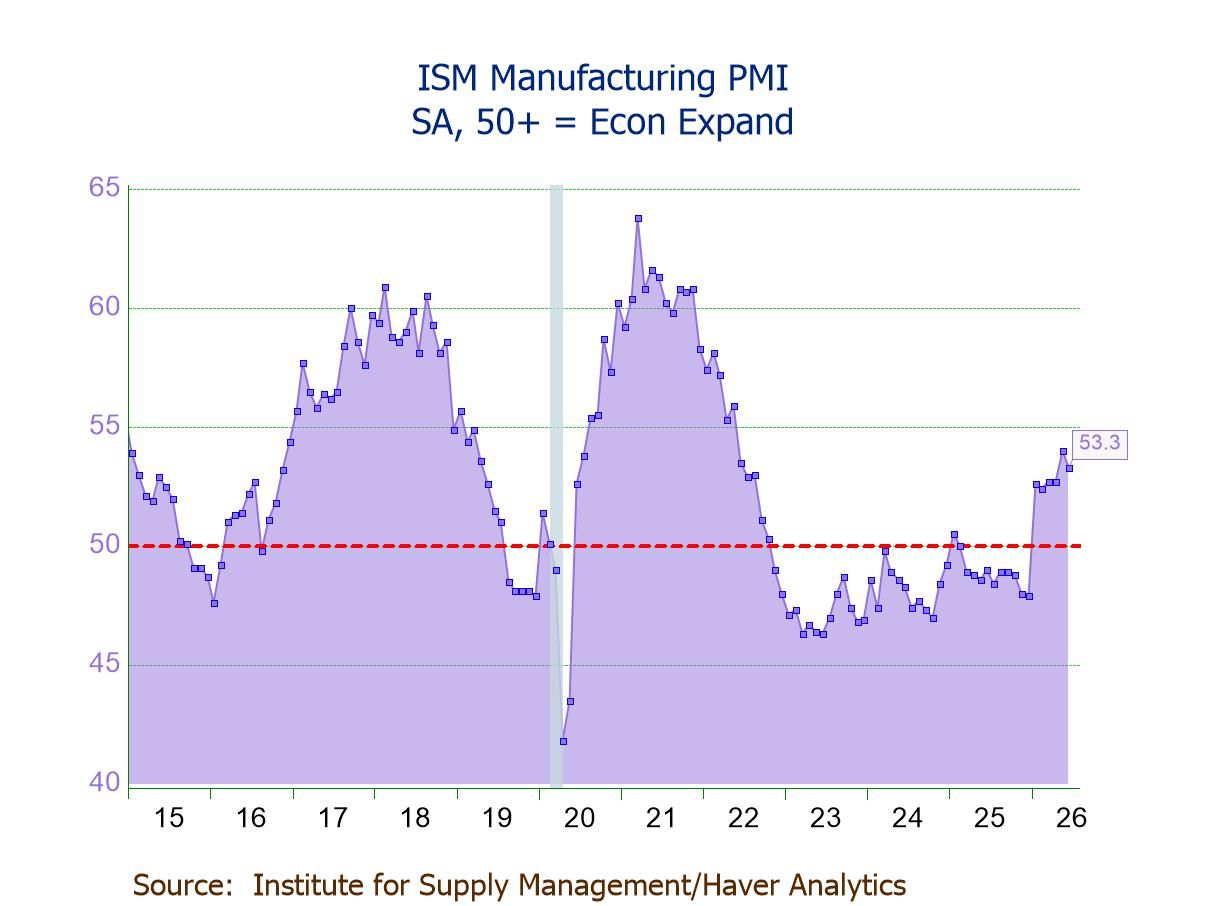
- ISM Mfg. PMI down slightly to 53.3 in June; sixth straight month above 50.
- Production (52.2) expands for the eighth consecutive mth.; new orders (56.0) for the sixth successive mth.
- Employment (49.7) contracts for the 33rd straight mth.; at the slowest contraction pace since Jan. ’25.
- Prices Index (73.0) at a four-month low, still indicating prices rising for the 21st consecutive mth.
- Exports (48.5) contract for the third time in four mths.; imports (52.9) continue to grow.
 USA| Jun 30 2026
U.S. Consumer Confidence Rebounds in June from a Four-Month Low
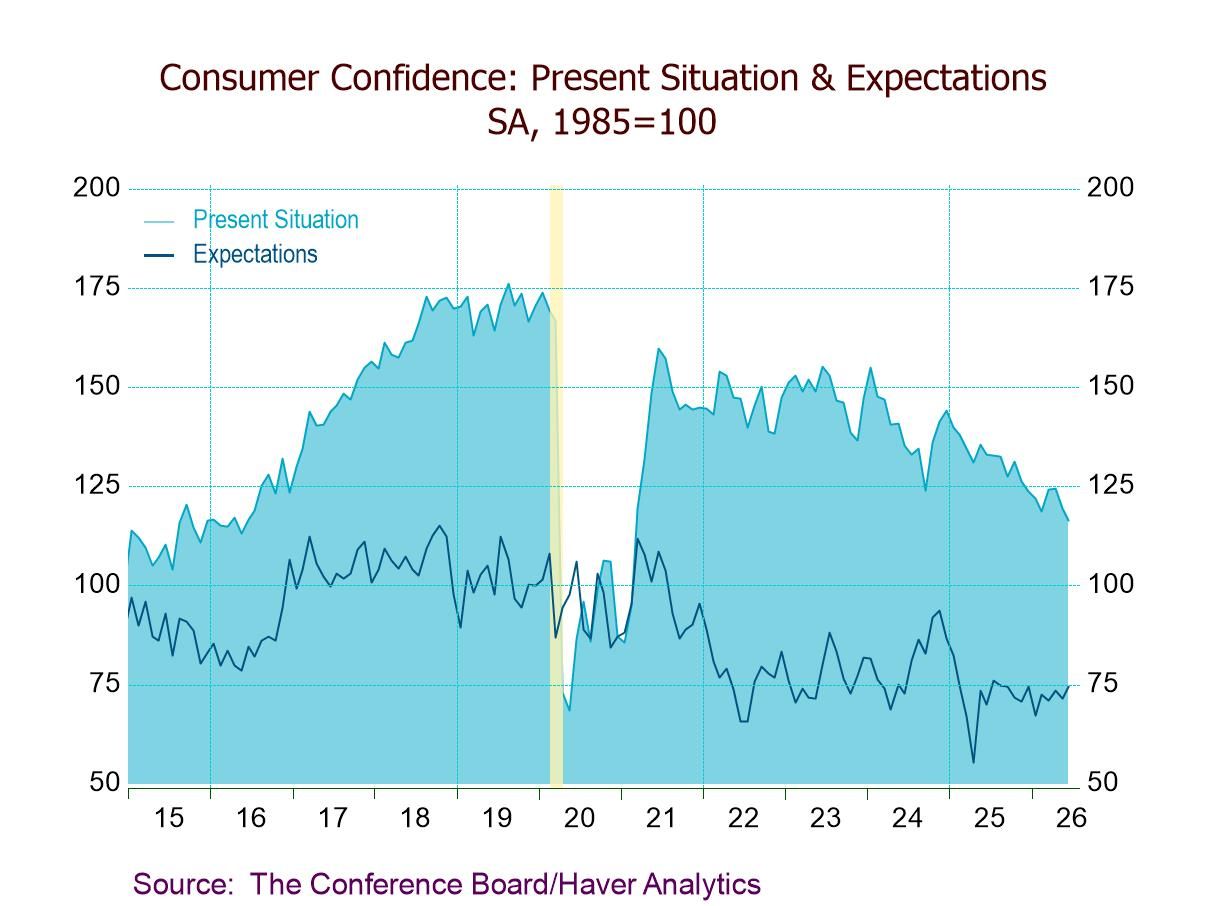
- Headline up 0.6 pts. to 91.2 in June, below expectations; fourth m/m increase in five mths.
- Present Situation Index down 3.0 pts. to 116.4, lowest since Feb. ’21.
- Expectations Index up 3.0 pts. to 74.4, a six-month high.
- Consumers less optimistic about current business & labor market conditions; more upbeat about future business & financial conditions.
- Inflation expectations down to 6.0%, lowest since Feb., as lower oil prices in recent weeks eased consumer inflation fears.
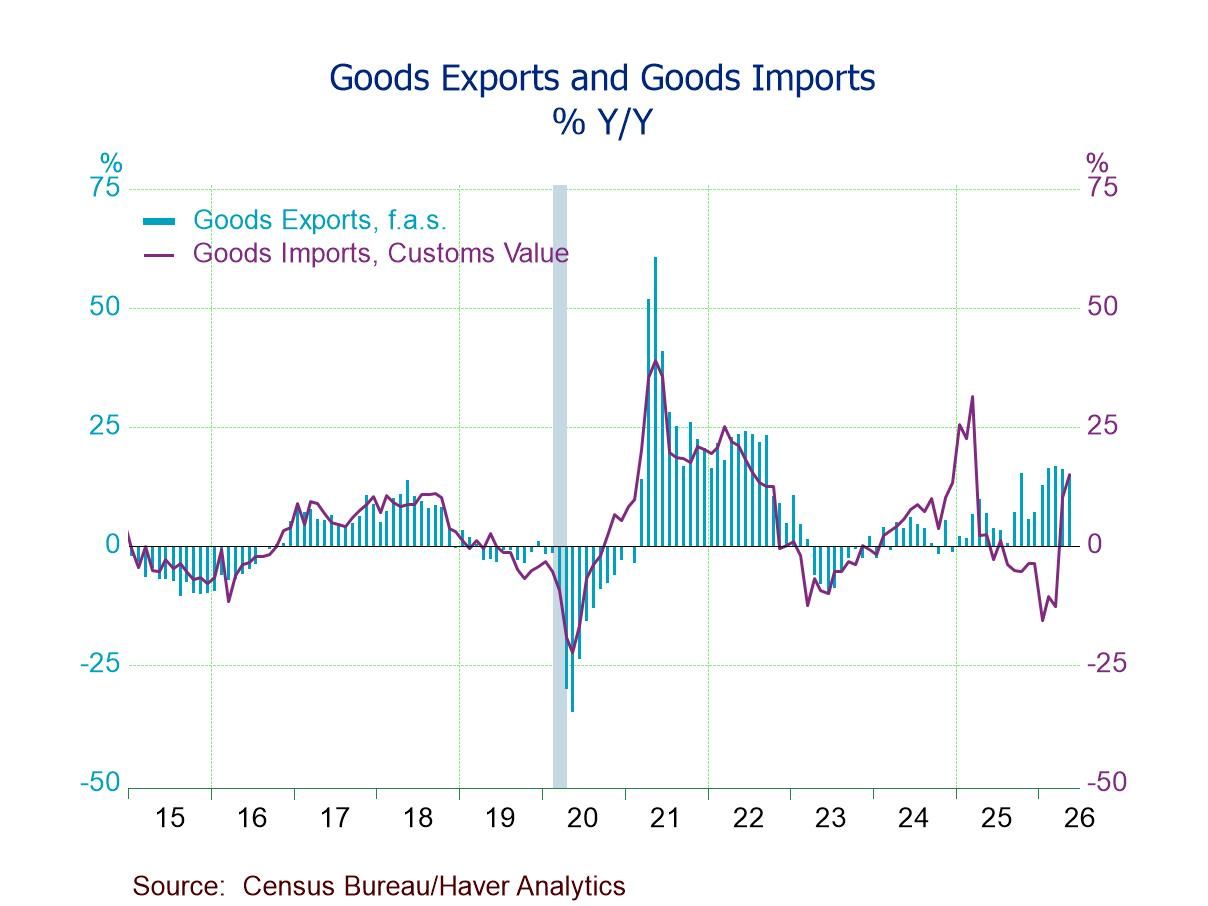
- Deficit: $105.75 bil. in May, up $22.75 bil. (+27.4%) from April’s $83.01 bil.
- Exports -5.4%, first m/m decline since Dec., led by a 9.2% drop in nonauto consumer goods exports.
- Imports +3.6%, fourth straight m/m rise to highest level since Mar. ’25, driven by an 11.5% gain in imports of other goods.
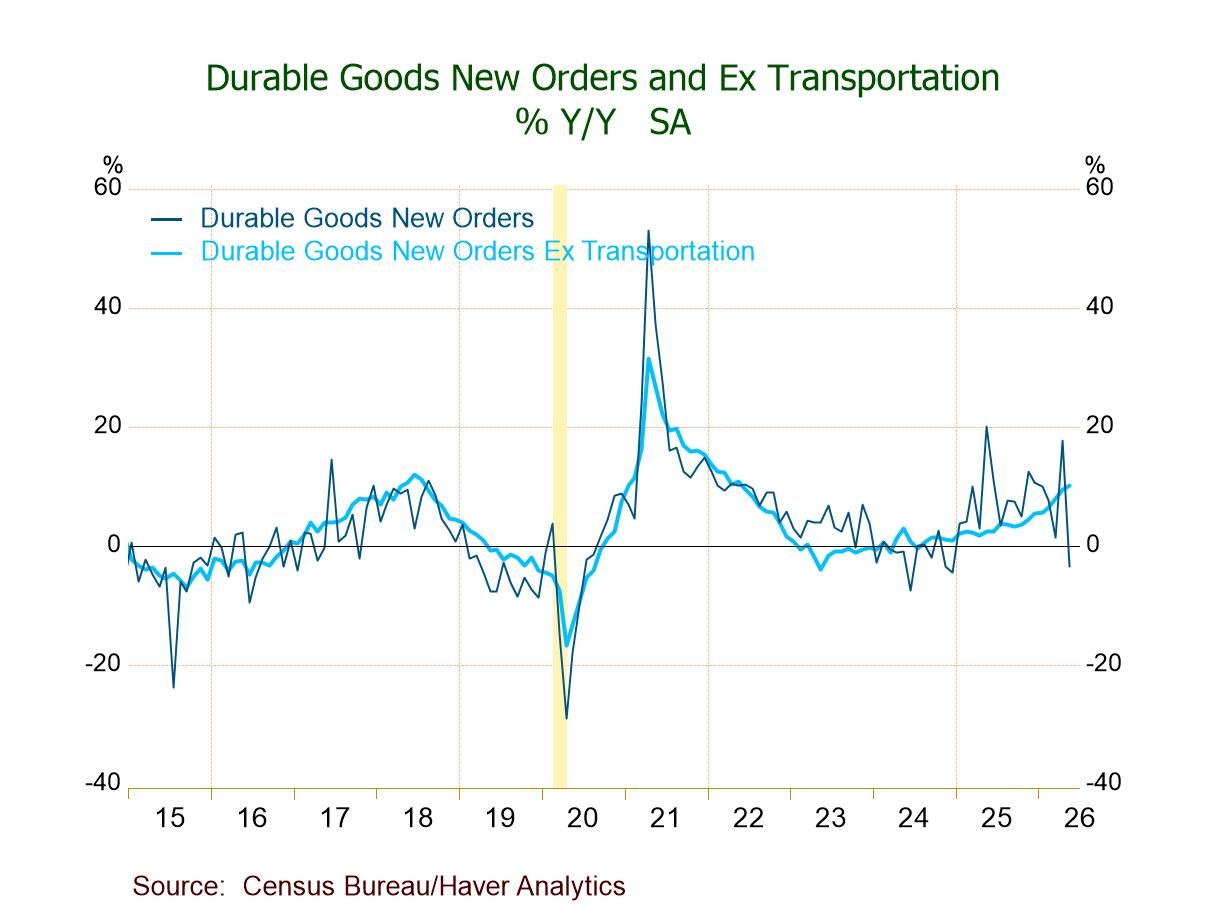
- May headline orders -4.5% m/m, first fall in three mths.; -3.5% y/y, first negative reading since Dec. ’24.
- Nondefense aircraft & parts -51.8% m/m vs. April’s +167.4%.
- Transportation orders -14.0%, first m/m drop since Feb.; orders ex transp. +1.3%, 13th straight m/m rise.
- Core capital goods shipments +0.3%, eighth gain in nine mths., pointing to a moderate contribution to Q2’26 GDP from business equipt. spending.
- Durable goods shipments +1.0%; unfilled orders +0.6%; inventories +0.2%.
 USA| Jun 24 2026
U.S. New Home Sales Unexpectedly Hit a Four-Month Low in May
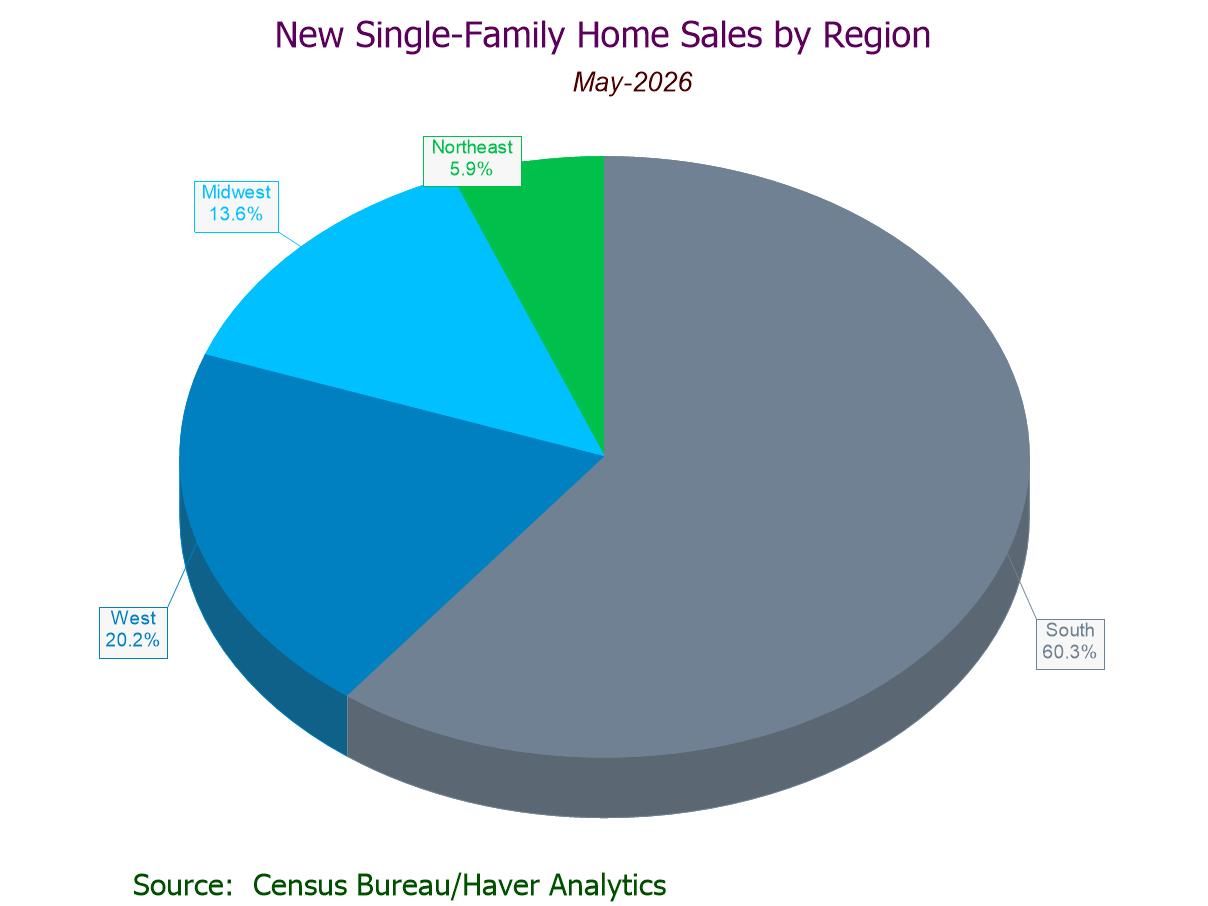
- Sales -7.3% m/m (-6.8% y/y) to 580,000 in May; down 23.4% from a November high.
- Sales m/m down in the West (-26.9%) and South (-4.1%); up in the Midwest (+16.2%) and Northeast (+3.0%).
- Sales y/y down in all regions except the Northeast (+17.2%).
- Median sales price +2.0% m/m to $424,900, a 5-month high; avg. price +7.8% m/m to $540,600, highest since July ’22.
- Months' supply up to 10.3 mths., highest since July ’22.
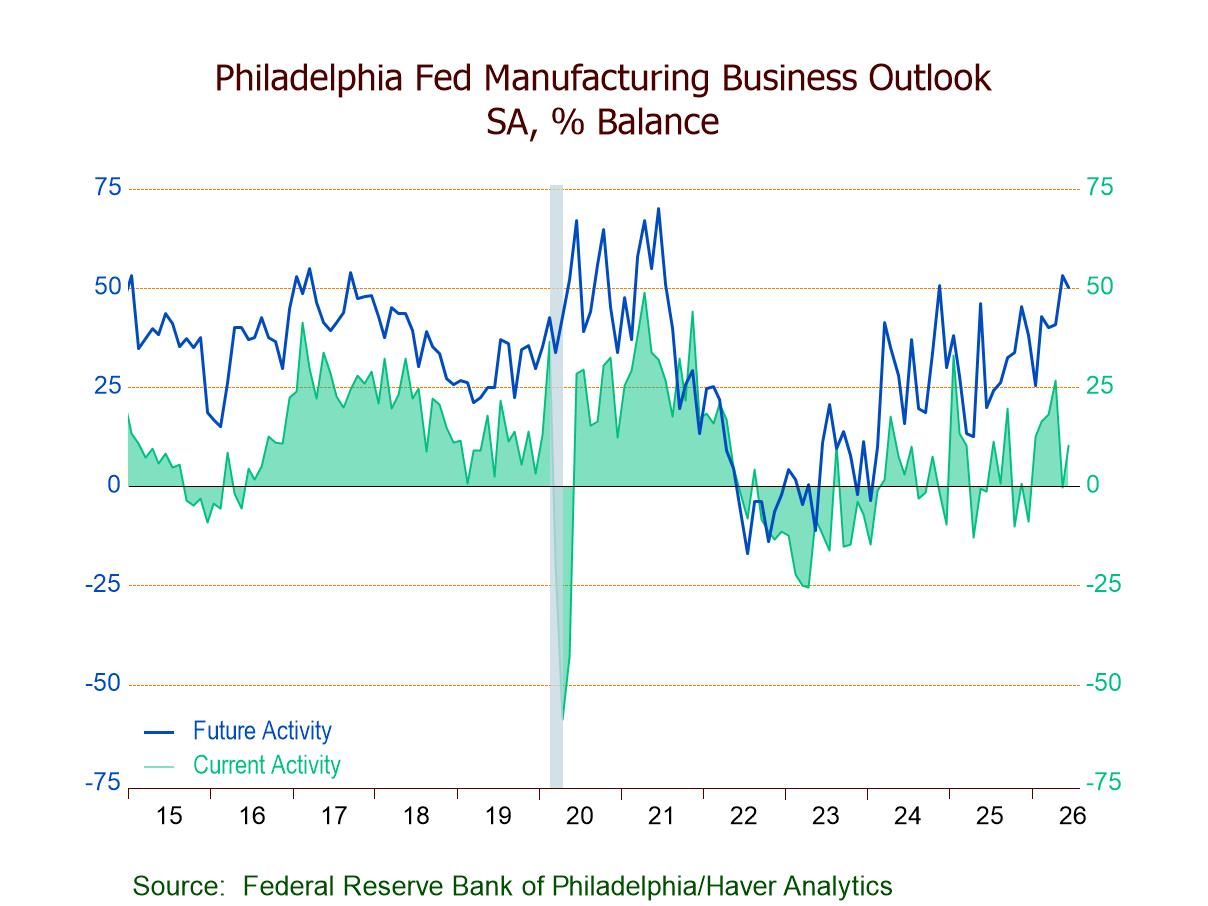
- Current General Activity Index up 10.7 pts. to 10.3 in June; fifth rise in six months.
- New Orders (27.3), sixth expansion in seven mths.; Shipments (14.9), seventh straight expansion; Unfilled Orders (10.5), first expansion since July ’25.
- Employment (7.9), a five-month high after two mths. of contraction.
- Inflation indicators: Prices Paid up (53.2); Prices Received down (20.3, a four-month low).
- Future General Activity Index down to a still-expansion-level 50.2; most subindexes up and positive; future price indexes remaining above long-run avgs.
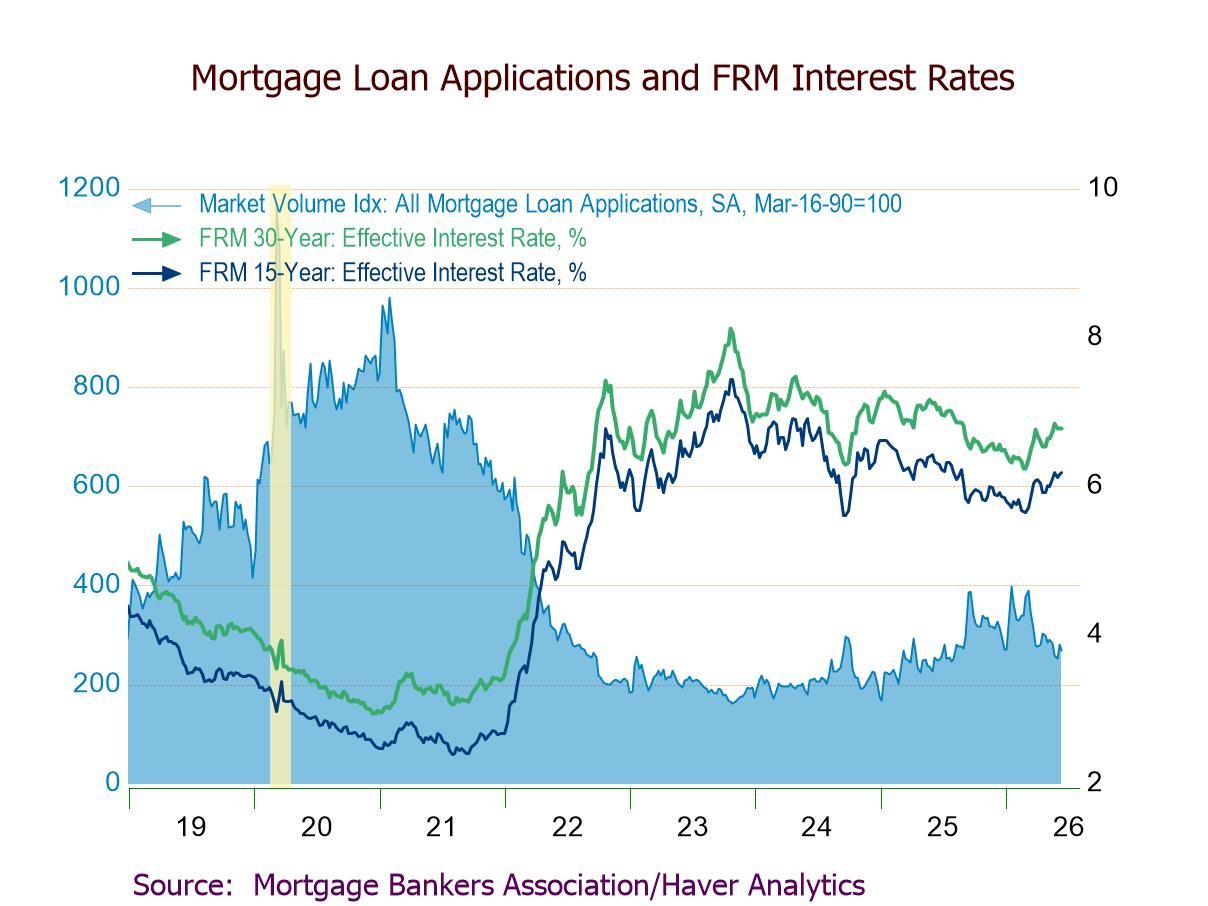
- Purchase applications -3.4% w/w, down for fourth time in five weeks; refinance applications -4.5% w/w, seventh fall in eight weeks.
- Effective interest rate on 30-year fixed loans unchanged at 6.78%, up from a late-February low of 6.24%.
- Average loan size down for the second time in three weeks, lowest since the April 3 week.
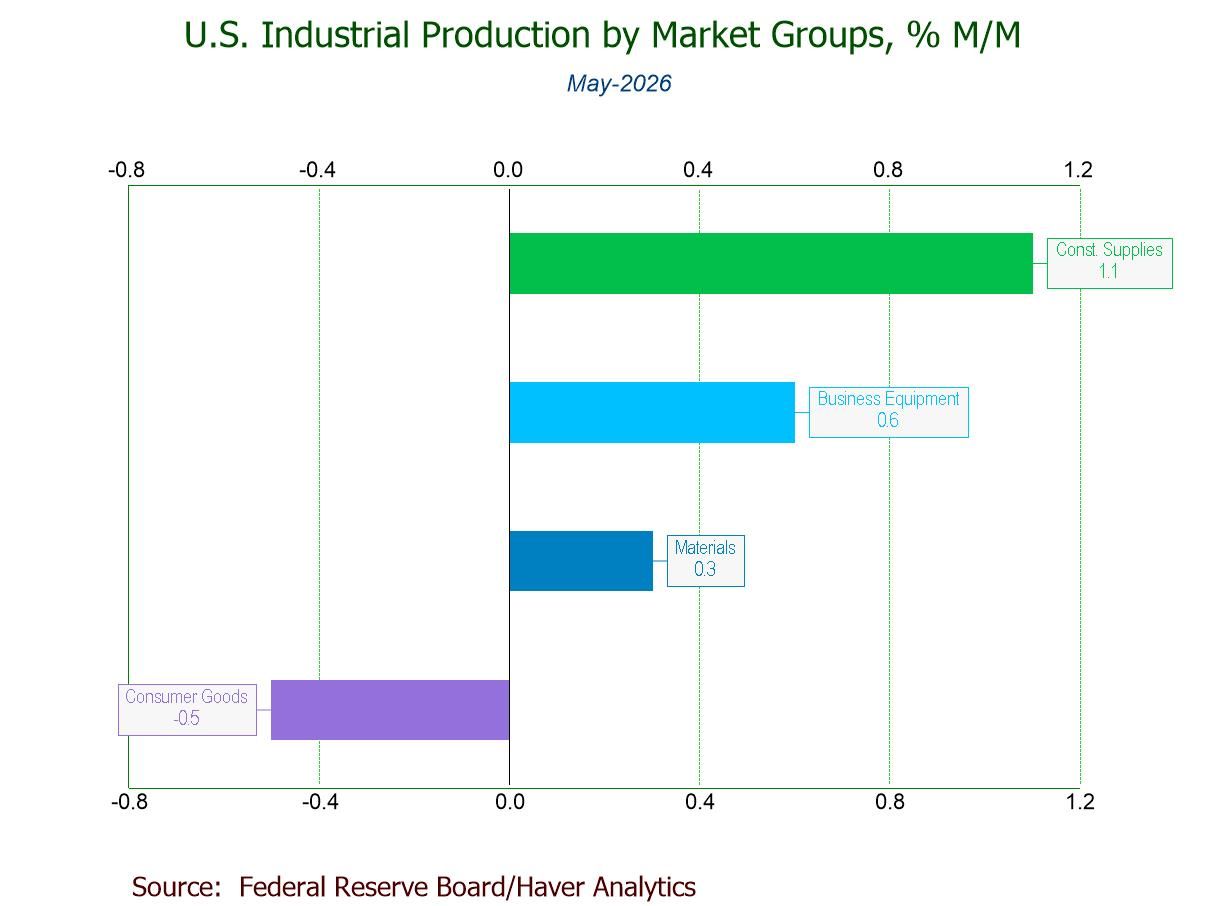
- May IP +0.1% (+1.7% y/y), third m/m increase in four months, led by a 1.3% gain in mining.
- Manufacturing unchanged (+1.4% y/y), w/ durables +0.8% and nondurables -0.9%.
- Selected high-tech +1.8%, third straight m/m rise; motor vehicles +1.2%, fifth gain in six mths.
- Utilities -0.4%, led by a 1.7% drop in electric utilities output.
- Key categories in market groups mostly up.
- Capacity utilization up to a 10-month-high 76.2%; mfg. capacity utilization steady at 75.7%.
 USA| Jun 11 2026
U.S. Producer Prices Advance in May Led by Energy
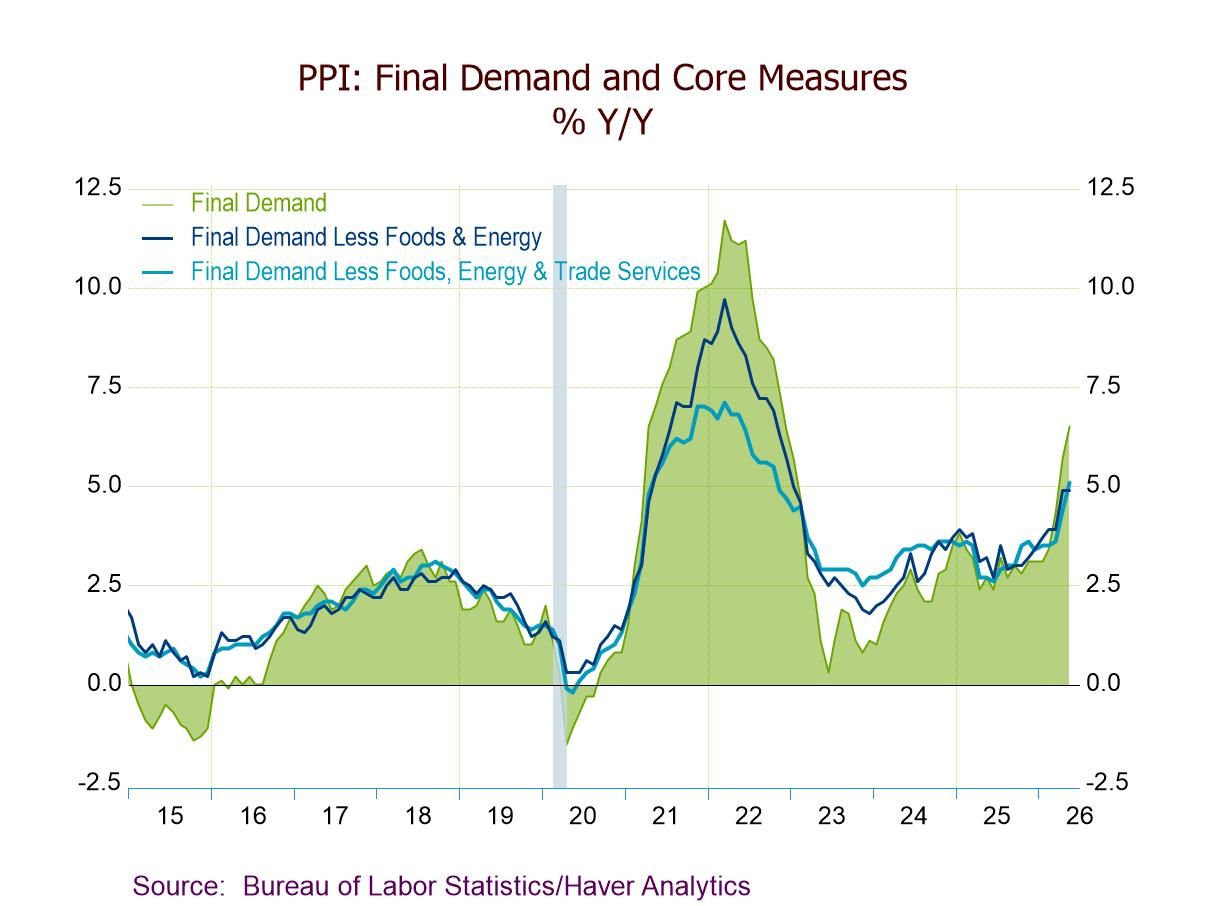
- May PPI +1.1% m/m (+6.5% y/y, highest since Nov. ’22), driven by a record 10.7% rise in energy and 0.6% in food prices.
- PPI ex foods & energy +0.4% (+4.9% y/y); services +0.3% (+4.9% y/y); construction +0.2% (+3.5% y/y).
- Core goods prices +0.8% (+5.1% y/y), largest m/m increase since Apr. ’22.
- Intermediate demand processed goods prices +3.5% (+13.3% y/y), strongest m/m gain since Mar. ’21.
 USA| Jun 09 2026
U.S. Existing Home Sales Reach a Five-Month High in May, Third M/M Gain in Four Months
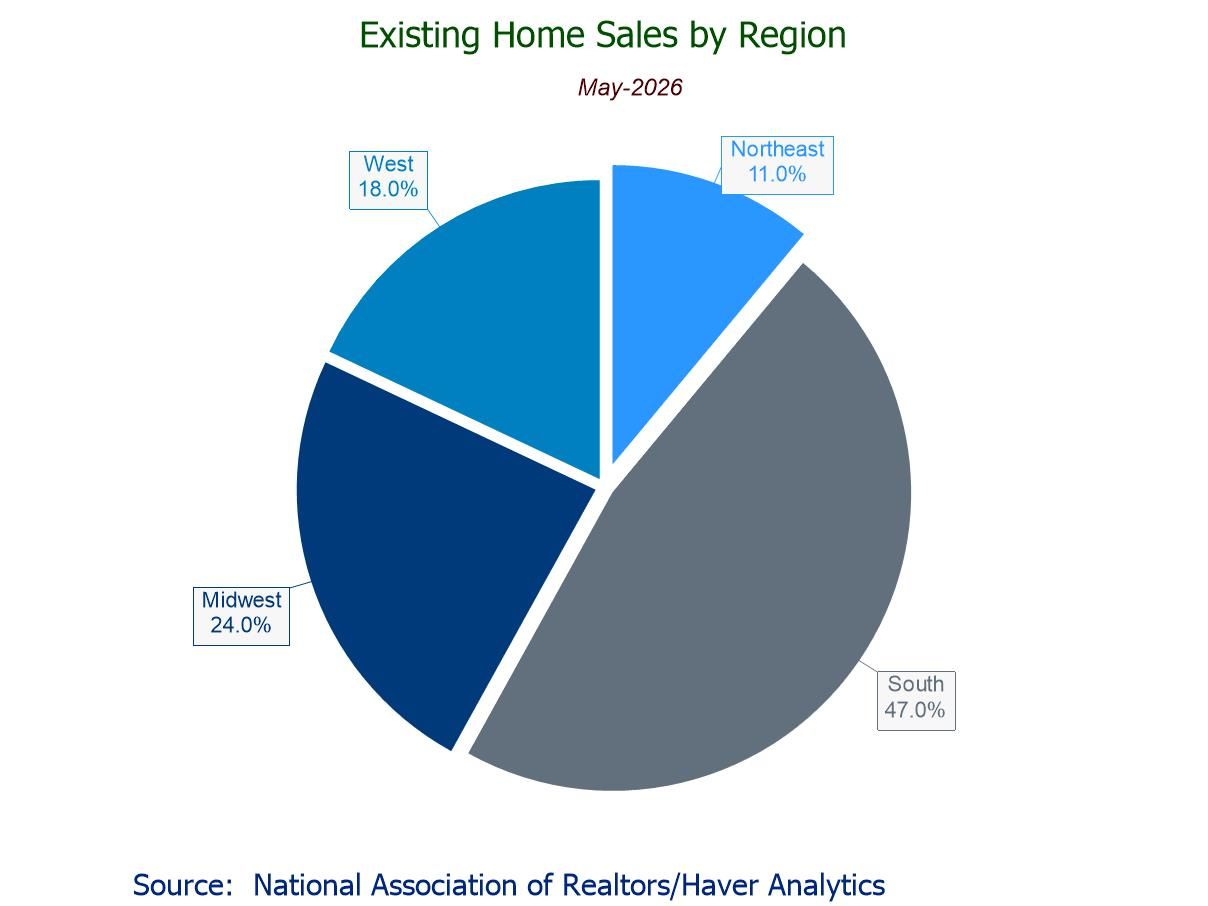
- May sales +3.2% m/m to higher-than-expected 4.17 mil.; +3.2% y/y, second straight y/y rise.
- Sales m/m up in the Midwest (+6.4%), South (+3.2%), and Northeast (+2.2%), flat in the West; sales y/y up in all regions except the Northeast (-8.0%).
- Median sales price +2.8% (+1.3% y/y) to $429,300, highest since June ’25.
- Unsold inventory +3.3% (+0.6% y/y) to 10-month-high 1.55 mil. units; 4.5 months' supply.
- of16Go to 4 page