

Never Have Investors Paid So Much for So Little Corporate Output
|in:Viewpoints
The debate rages on: do lofty corporate equity prices indicate an enormous speculative bubble or an emerging, tech-driven golden age? High equity valuations are naturally a basic part of the discussion, but price-to-earnings ratios (P/E ratios) alone do not fully reflect the grandeur of the expectations built into today’s stock prices. What makes market expectations remarkable is that high earnings multiples are based on profits that have already recorded extraordinary growth to the point of historically wide margins. Large multiples and remarkably wide margins together explain corporate equity values that are unprecedentedly huge in proportion to corporate operations. The United States will have to undergo a dramatic economic acceleration and an enduring, unusually rapid expansion to avoid a major disappointment for the stock market. By all appearances, stock prices will need the emergence of an AI-driven golden age if their present level is to be justified.
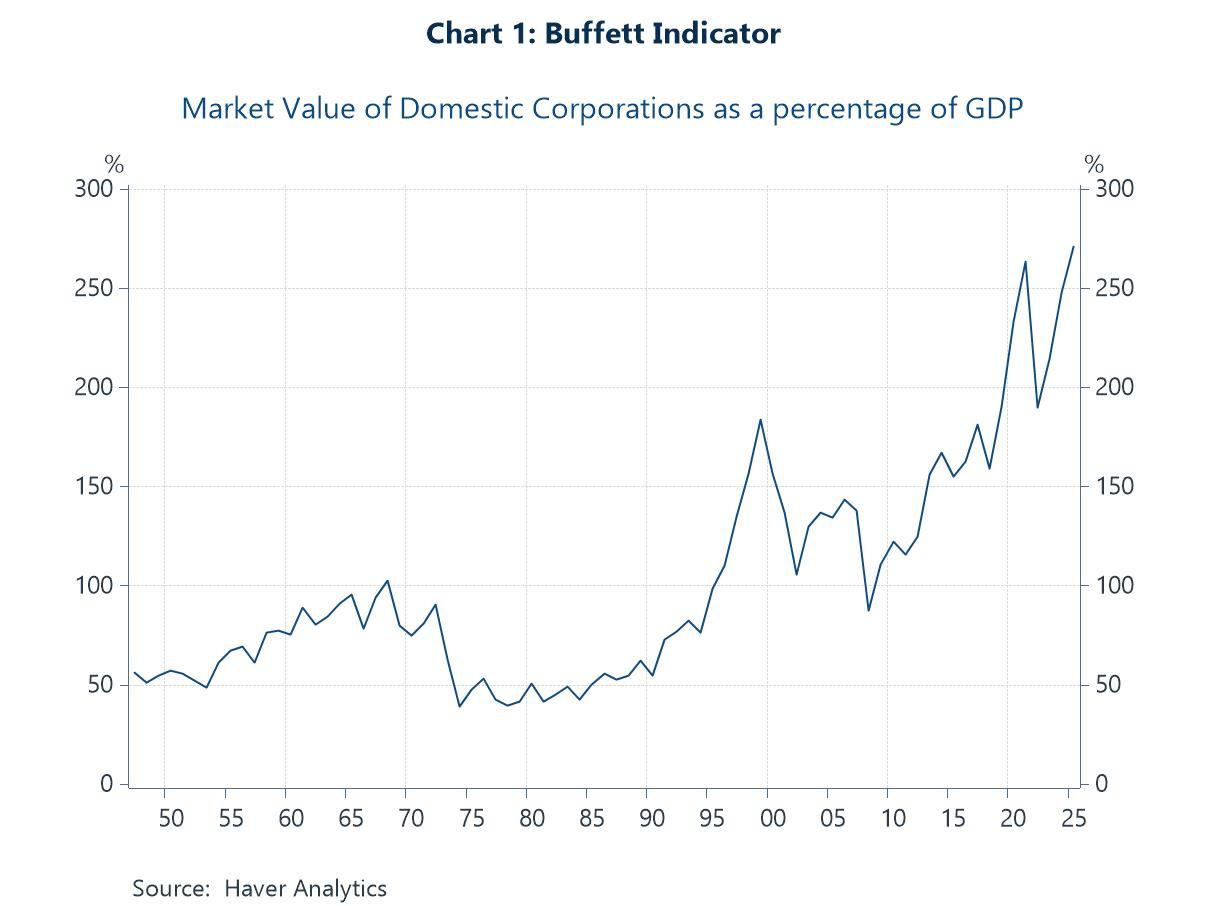
A number of market observers have noted that the Buffett Indicator, which is the total value of U.S. corporate equity relative to GDP, is at an exceptional record high (chart 1). For half of a century after World War II, corporate equity was at most equal to GDP and sometimes less than half of it; presently, that corporate equity is worth two-and-a-half times GDP.
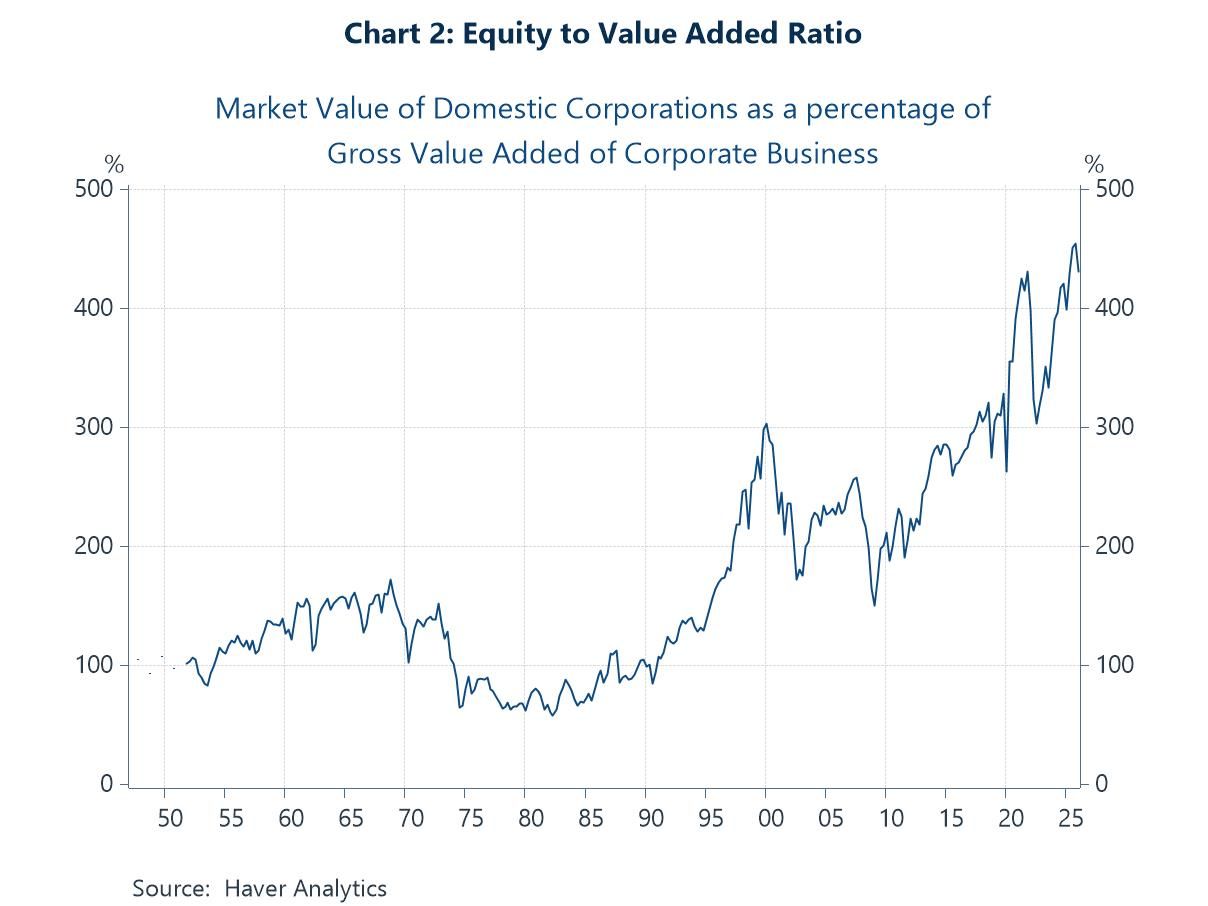
A more refined measure than the Buffett Indicator, which reasonably captures how both aggregate P/E ratios and aggregate profit margins in the broad economy relate to stock values, is the ratio of the market value of domestic corporations to the gross value added of corporate business—the US corporate sector’s equity-to-value-added ratio (E/VA; chart 2). This ratio is also at an all-time high. (A similar concept would be the ratio of equity to sales, but for a long historical perspective on the corporate sector within the national income and product accounts, corporate value added is a reasonable proxy. Similarly, the ratio of profits to value added is a reasonable proxy for profit margins.)
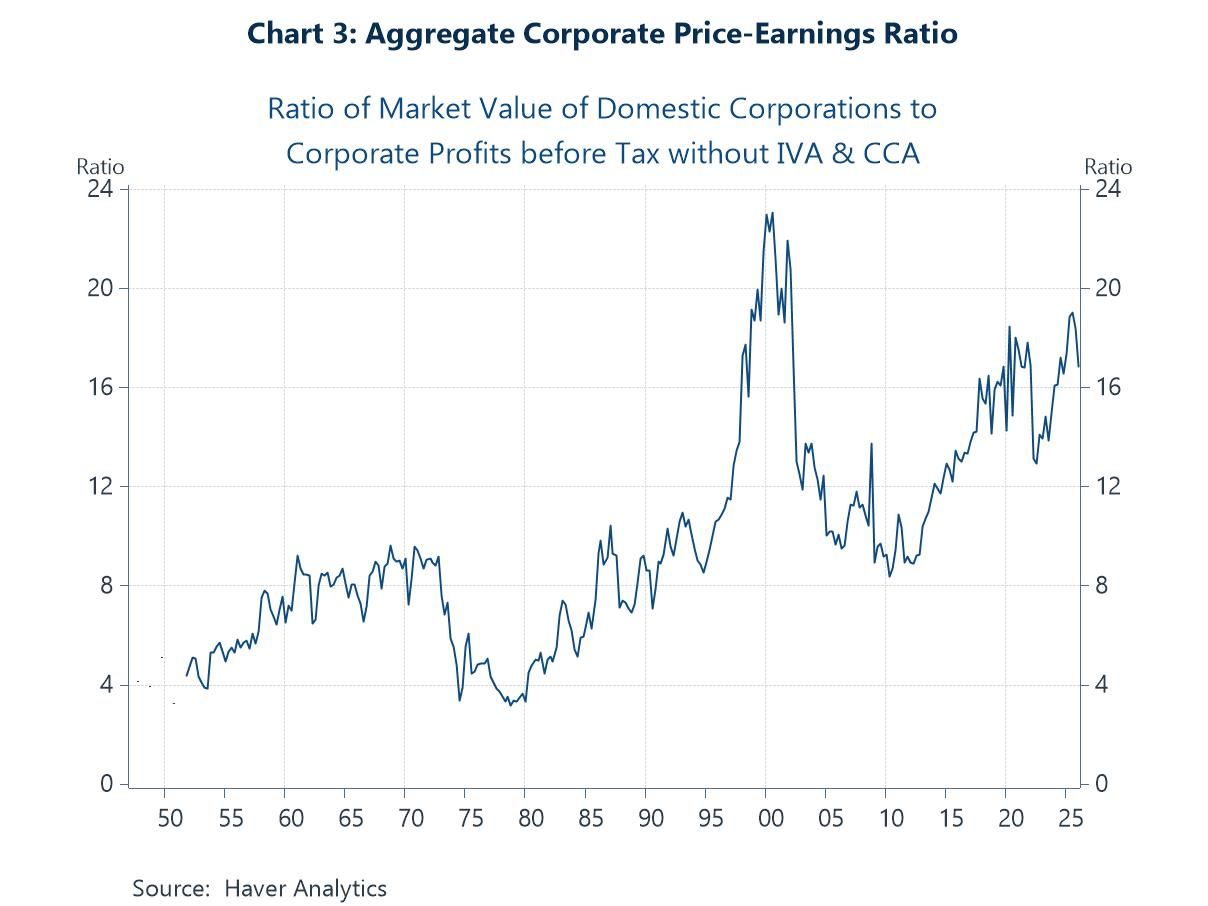
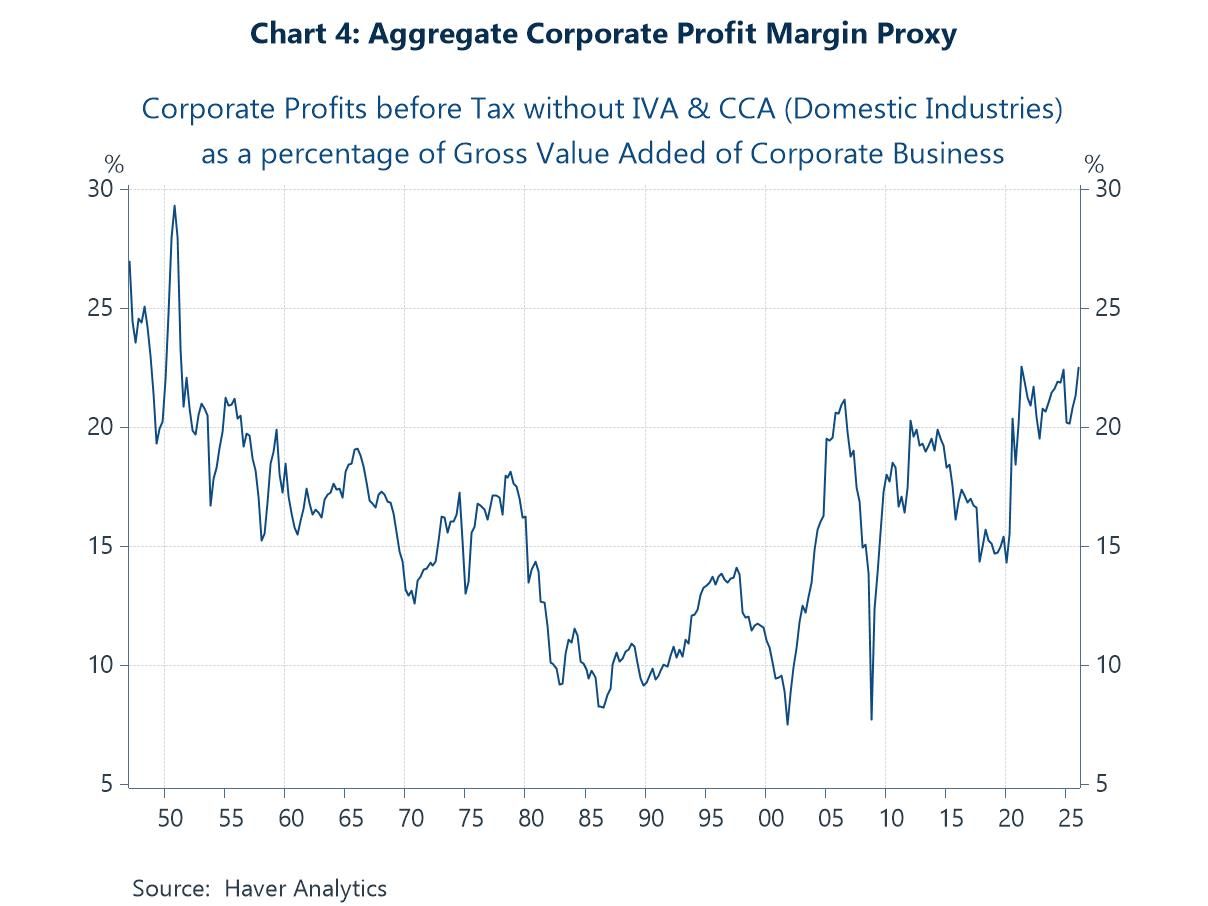
The stratospheric equity-to-value-added ratio reflects both high earnings multiples and extremely strong profits relative to value added (charts 3 and 4).
The E/VA is an imperfect but reasonable measure of how much markets believe our corporate sector is worth relative to what it produces. From 1947 through 1995, this ratio ranged between 58% and 172%, averaging 115%. Today it is four times that period’s average and two-and-a-half times its highest level.
The E/VA hit a record 454% in the fourth quarter of 2025. Although the ratio slipped a bit in the first quarter as the market ended March near the year’s low, equities surged during the spring, implying a new record in the second quarter in the neighborhood of 485% to 490%. These levels dwarf the dot-com peak of 302% in the first quarter of 2000 and even the peak of 327% on the eve of the pandemic, which followed an exceptional decade of mostly zero interest rates and unprecedented liquidity. Today’s E/VA is all the more remarkable because interest rates are nowhere near zero and, based on market expectations, more likely to head up than down.
Granted, this measure of how the market prices corporations for each dollar they contribute to the economy is not without flaws. Indeed, Haver Analytics calculates the last few years of the value of domestic corporations because the Fed discontinued the series in 2014 out of accuracy concerns relating to the increase in international holdings.
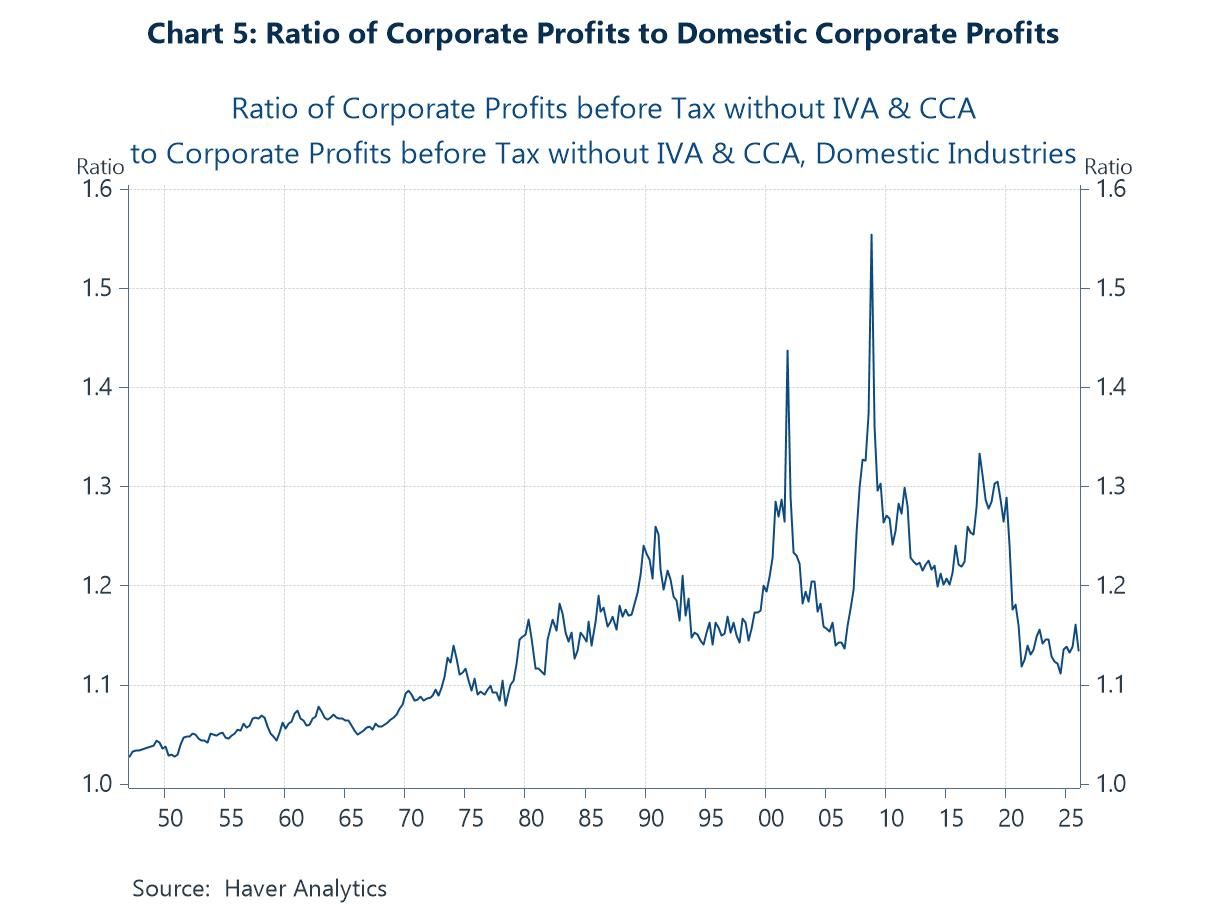
Perhaps the biggest data issue is that equity values reflect the total profits of U.S. corporations, some of which come from overseas operations and is earned on value added to other economies, and, conversely, some of our domestic corporate value added supports earnings belonging to foreign corporations with U.S. subsidiaries. As these international flows of profits vary, they can change the ratio of the total profits of U.S. corporations to total domestic profits. When that ratio rises, it increases the value of U.S. corporations relative to (domestic) value added, everything else equal. Indeed, the ratio of U.S. corporate profits to domestic profits has moved around in the last 75 years and did rise considerably, by nearly 25% from 1950 to 2000. However, it has since given back more than half of that gain (chart 5). Moreover, this ratio is only about 10% above its all-time low, which doesn’t do much to explain the more than four-fold increase in the E/VA over the same period.
Even allowing for some data problems, P/E ratios are anticipating years of very strong growth in earnings starting from margins that are already extraordinarily wide. Maybe AI will help the economy achieve some combination of persistently extraordinary margins and unusually rapid corporate sector growth, thereby generating a spectacular, enduring profits rise. Otherwise, the stock market could be in for deep trouble.
Thus, it looks like we are headed for either a bursting bubble or a rapidly unfolding economic golden age—or maybe one and then the other.

David A. Levy
AuthorMore in Author Profile »David A. Levy has applied the Profits Perspective—the macroeconomic framework centered on the aggregate profits identity—to economic analysis and forecasting for 50 years. Developed over a century ago by his grandfather, Jerome Levy, this perspective was unknown to the discipline until Michal Kalecki introduced it a generation later.
In 1979, Levy joined his father, S Jay Levy, a forecaster and consultant since 1949. He later served as Vice Chairman of the Levy Economics Institute of Bard College and director of the Levy Institute Forecasting Center. In 2001, he returned to the for-profit sector, heading the Jerome Levy Forecasting Center, LLC until retiring in 2026. He is planning educational efforts focused on the Profits Perspective.
Levy’s uncommon approach led to several maverick calls on cyclical turning points and interest rates. In early 2004, he launched a hedge fund to position for an eventual collapse in the housing bubble and interest rates; the fund closed after five years with all investors enjoying cumulative net gains of at least 500%.
Levy has briefed and addressed members of Congress, the executive branch, and the Federal Reserve Board. He was selected for the federal government’s Competitive Policy Council Infrastructure Subcouncil in 1992. In 1997, President Clinton appointed him to the Commission to Study Capital Budgeting.
For over four decades, Levy has been quoted in the press, appeared on financial programs, and written articles. He is coauthor, with S Jay Levy, of Profits and the Future of American Society (HarperCollins). He earned a B.A. in mathematics from Williams College and an M.B.A. from Columbia Business School.
 Asia
Asia