Global| Nov 19 2026
Charts of the Week: The rising cost of growth
by:Andrew Cates
|in:Economy in Brief
Summary
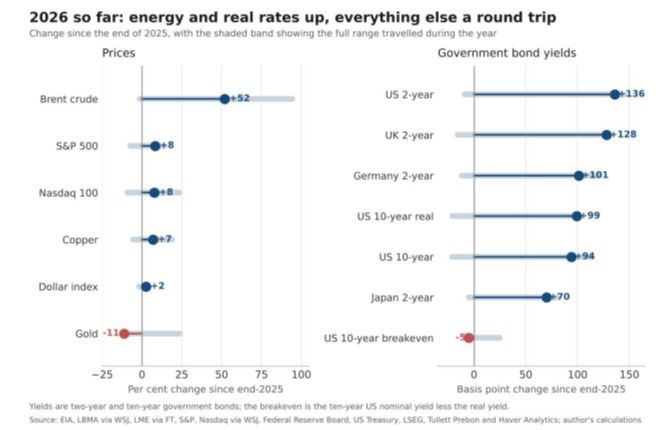
Falling oil prices in recent weeks should offer some relief to a world economy still absorbing the effects of the energy shock. Households stand to gain as fuel bills ease, while businesses face less pressure on costs. Yet borrowing costs have continued to rise across the major bond markets, even as inflation expectations have barely changed (chart 1). The tension is clearest in the UK, where shorter-dated gilt yields have climbed despite the fall in crude. With inflation picking up as demand for labour weakens, the Bank of England has little room for manoeuvre (chart 2). In the US, by contrast, consumer spending has held up and import costs have risen. Even so, data on both sides of the Atlantic have increasingly surprised forecasters in the same direction, raising the question of how far the two economies are responding to a common pressure (chart 3). The question in Asia is whether domestic spending can carry growth. China’s factories continue to expand faster than its consumers are willing to spend, leaving manufacturers more reliant on buyers abroad (chart 4). In Japan, weaker trade has coincided with falling household consumption, leaving public demand and business investment to sustain output (chart 5). France illustrates how rising borrowing costs can narrow a government’s choices. Investors now demand a higher premium to lend to France than to Italy, just as defense and energy commitments are adding to the demands on the French budget (chart 6).
What markets have repriced
Two price increases have endured this year: energy and the real cost of borrowing. Short-dated government bond yields have risen across the major markets. The US ten-year real yield reached 2.92%, its highest since late 2008, while inflation expectations barely changed. Investors now require a substantially higher return after inflation to lend to the US government. Elsewhere the reversals have been striking. Gold, up 24% by the end of January, now stands 11% below its level at the start of the year. Technology shares and industrial metals have surrendered their earlier gains.
Chart 1: Changes in prices and government bond yields since the end of 2025
UK gilt yields break with oil
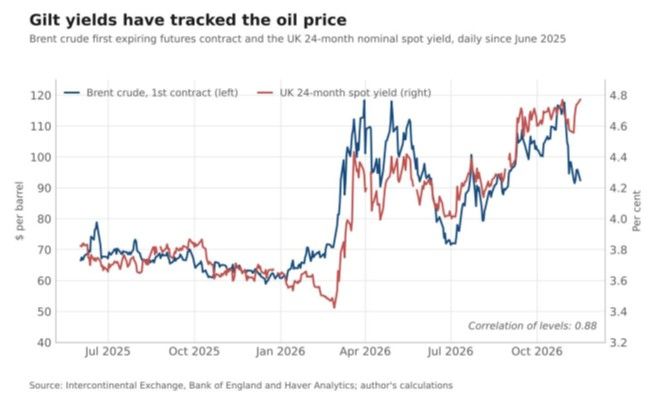
For much of the past 18 months, Brent crude and the two-year gilt yield moved together. Since late October, Brent has fallen from $117 a barrel to about $92 as US inventories rose, even though risks to Gulf supply persist. The two-year gilt yield, meanwhile, has climbed to 4.77%, its highest level in those 18 months. This is the first sustained divergence since the spring. The explanation appears to lie closer to home. UK data have been running ahead of expectations, and the Bank of England’s chief economist has signalled support for a December rate increase. Cheaper oil has offered little relief to gilt investors weighing the likely response of the Monetary Policy Committee.
Chart 2: Brent crude and the UK two-year government bond yield
Why US and UK data surprises now move together
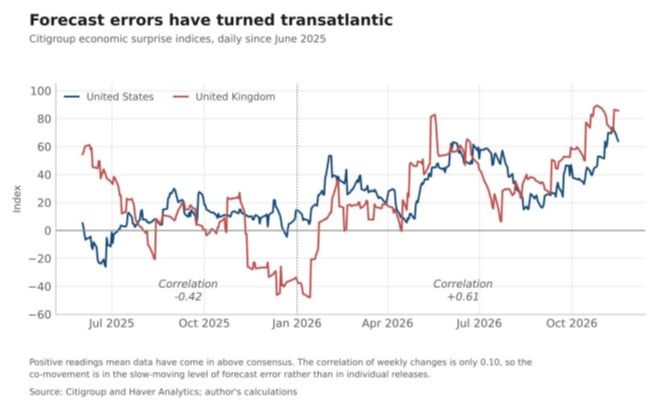
Stronger-than-expected UK data may help explain why two-year gilt yields have continued to rise even as oil prices have fallen, and still-firm inflation has strengthened the case for a further increase from the Bank of England. The pattern of surprises also has a transatlantic dimension. Economic surprise indices track how frequently published figures exceed or fall short of consensus forecasts. For much of last year, upside surprises in the UK tended to coincide with downside surprises in the US. This year they have tended to move together, with their correlation shifting from −0.42 to +0.61 (chart 3). The link is clearest in the underlying trend, suggesting that forecasters have misjudged a common influence, possibly the effects of the energy shock. The economic picture still differs on either side of the Atlantic, with US consumer spending holding up as UK labour demand weakens.
Chart 3: US and UK economic surprise indices
China’s consumers lag its factories
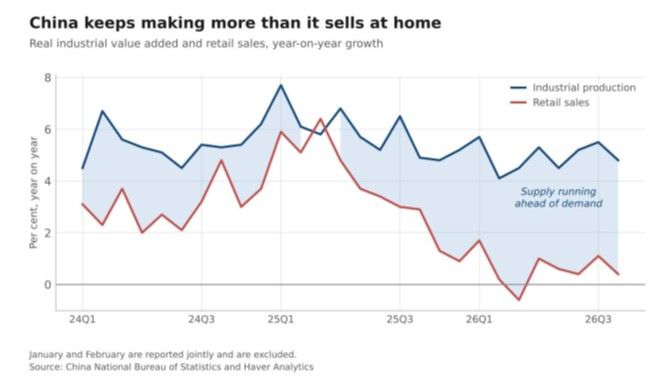
China’s industrial output rose 4.8% in the year to October while retail sales rose just 0.4%, a gap that has persisted since the spring. Investment has fallen sharply, with property development down by more than a fifth in the year to date and the contraction still deepening. With domestic spending weak, manufacturers have a stronger incentive to seek customers abroad. The resulting competition has helped restrain goods prices in importing economies, partly offsetting the rise in energy costs. Last month’s increase in US import costs shows the limits of that offset.
Chart 4: Chinese industrial production and retail sales
Trade brings Japan’s expansion to a halt
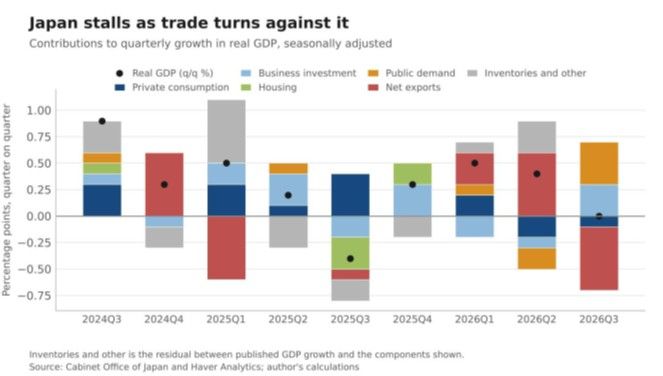
Japan’s economy stalled in the third quarter after four consecutive quarters of growth. Net trade subtracted 0.6 percentage points from quarterly GDP growth, its largest drag since early last year. Household consumption fell for a second successive quarter, leaving public demand and business investment to sustain output. That poses a dilemma for the Bank of Japan, whose governor continues to argue for higher interest rates. A weak yen raises the domestic price of imported energy, squeezing households whose spending is already falling, yet tighter policy would bear down on an economy in which private demand is fragile.
Chart 5: Contributions to quarterly growth in Japanese real GDP
Why France still pays a premium
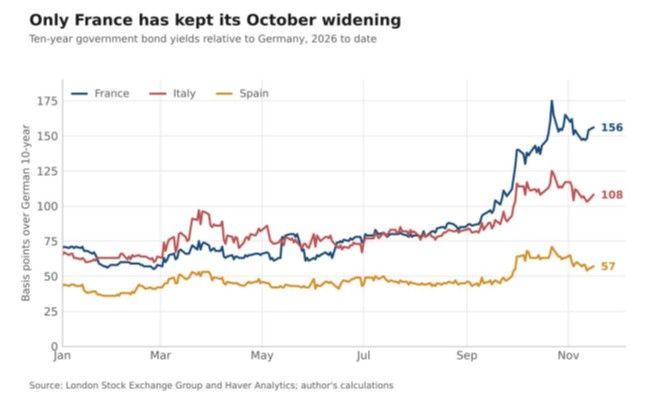
The yield spreads of France, Italy and Spain over Germany all peaked on the same day in late October, suggesting a common cause for the initial sell-off. Their subsequent paths tell a different story. Italy and Spain have reversed much of the widening. France has retained almost all of it. Investors now demand 156 basis points over Germany to hold ten-year French debt, compared with 108 for Italy. The familiar distinction between the euro area’s core and periphery offers little guidance here. France’s fiscal outlook, and doubts about its government’s capacity to improve it, offer a better one. With German yields themselves appreciably higher this year, both the benchmark rate and the wider spread have raised the cost of French borrowing. An incoming president of the European Central Bank will have reason to watch both next year.
Chart 6: Ten-year government bond spreads over Germany

Andrew Cates
AuthorMore in Author Profile »Andy Cates joined Haver Analytics as a Senior Economist in 2020. Andy has more than 25 years of experience forecasting the global economic outlook and in assessing the implications for policy settings and financial markets. He has held various senior positions in London in a number of Investment Banks including as Head of Developed Markets Economics at Nomura and as Chief Eurozone Economist at RBS. These followed a spell of 21 years as Senior International Economist at UBS, 5 of which were spent in Singapore. Prior to his time in financial services Andy was a UK economist at HM Treasury in London holding positions in the domestic forecasting and macroeconomic modelling units. He has a BA in Economics from the University of York and an MSc in Economics and Econometrics from the University of Southampton.
More Economy in Brief