Global| Aug 26 2026
Charts of the Week: Resilient Growth, Restless Yields
by:Andrew Cates
|in:Economy in Brief
Summary
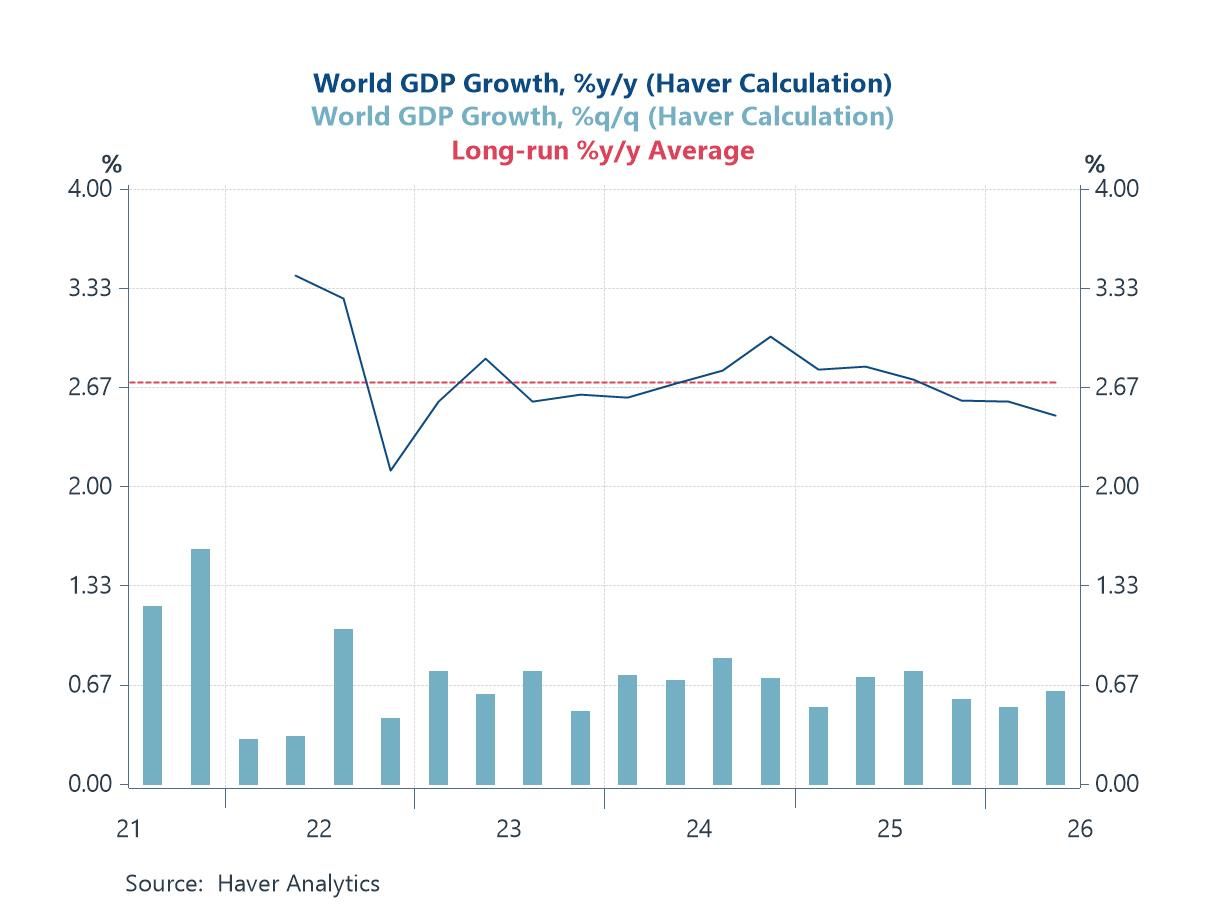
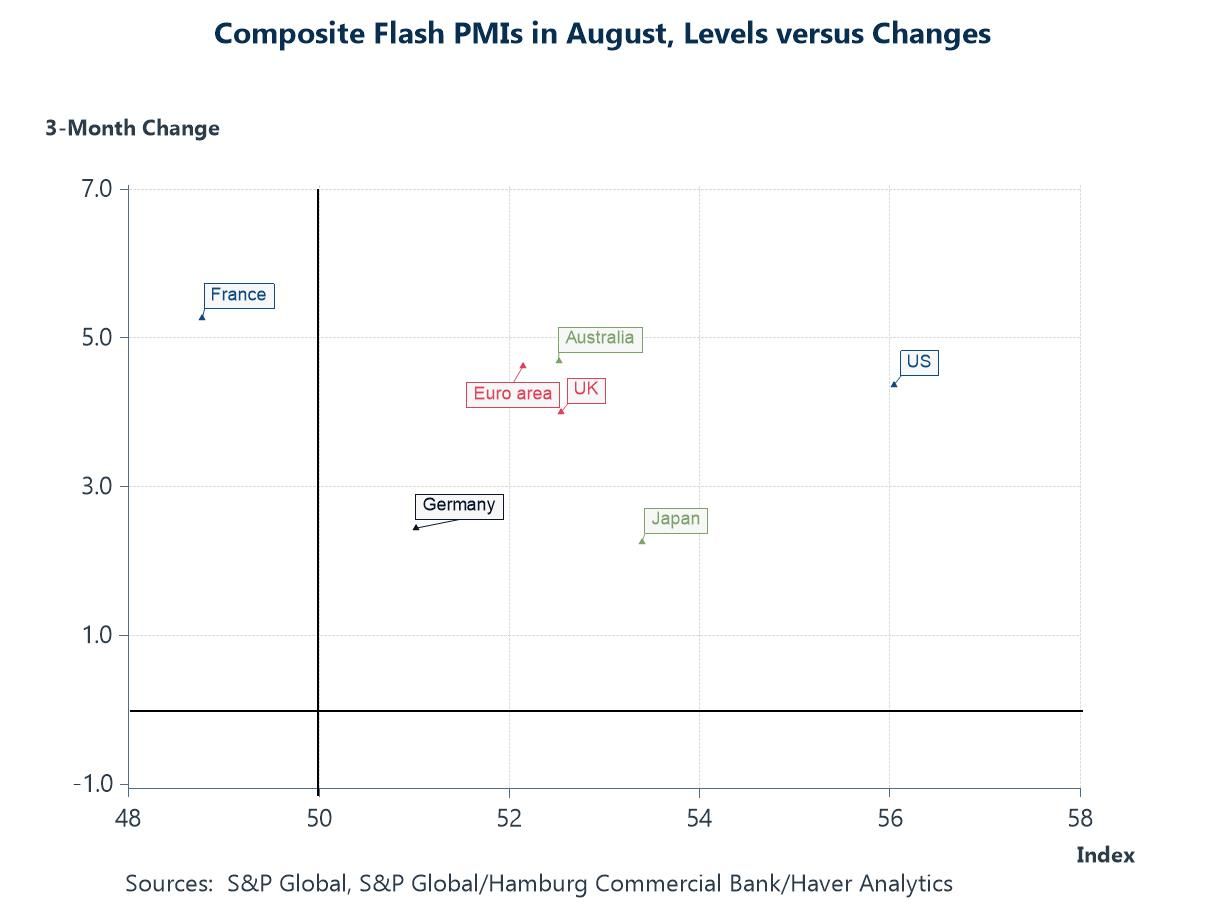
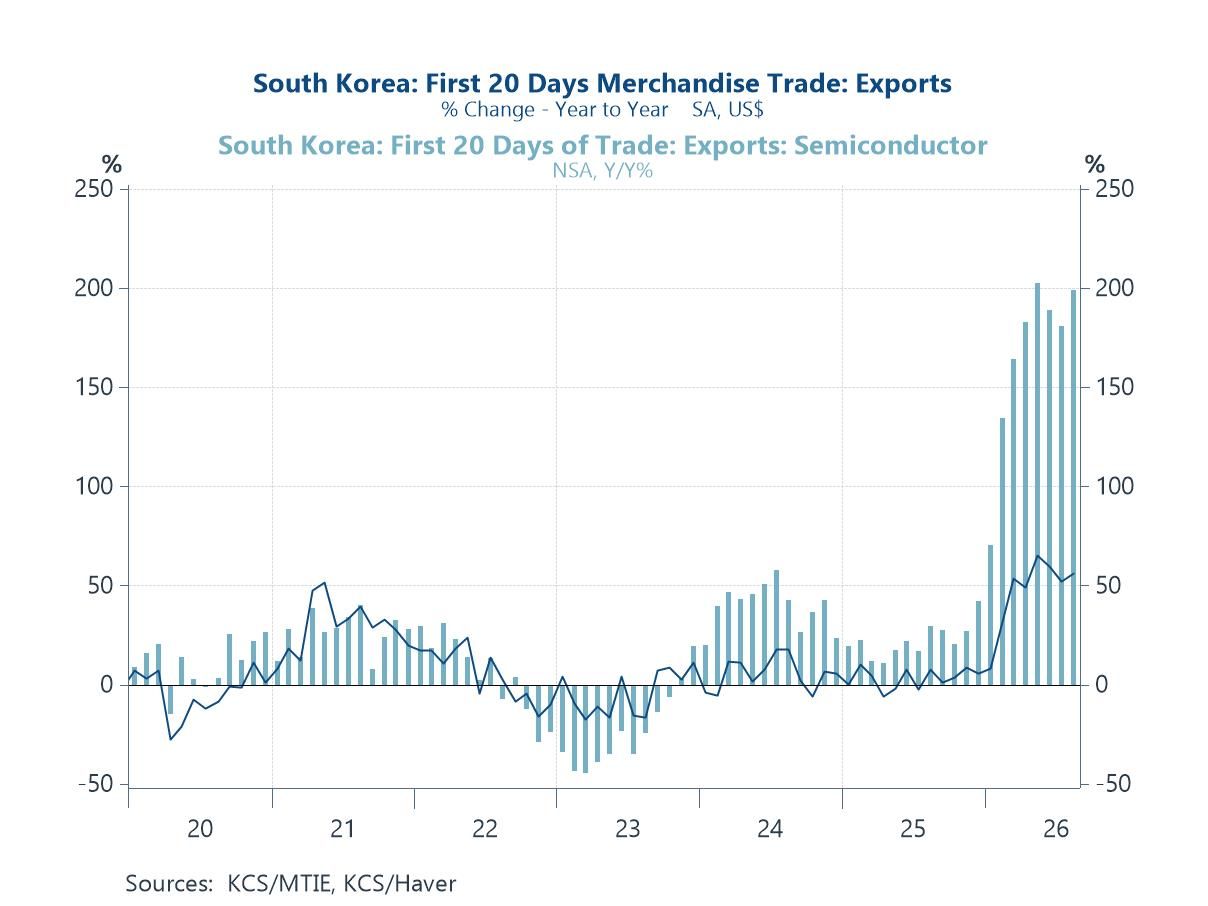
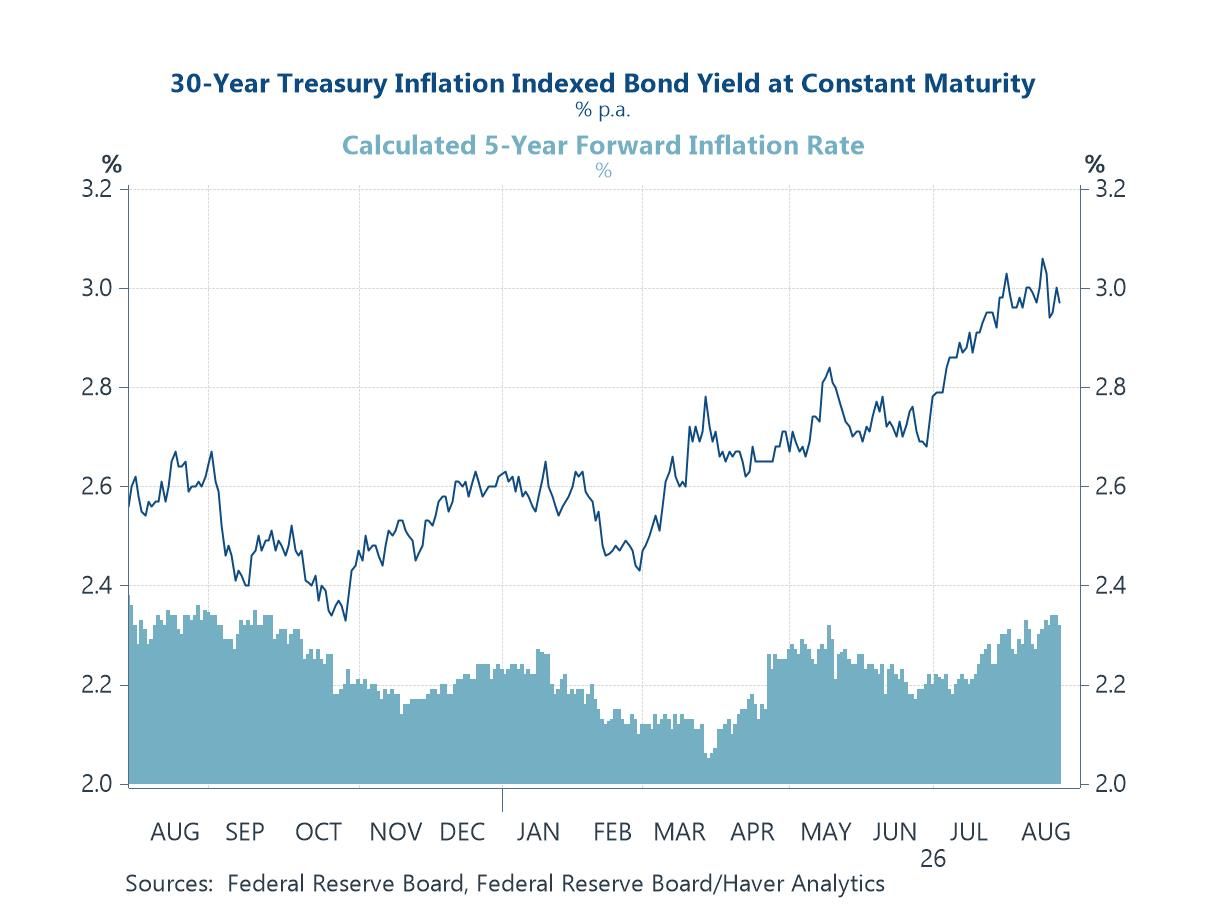
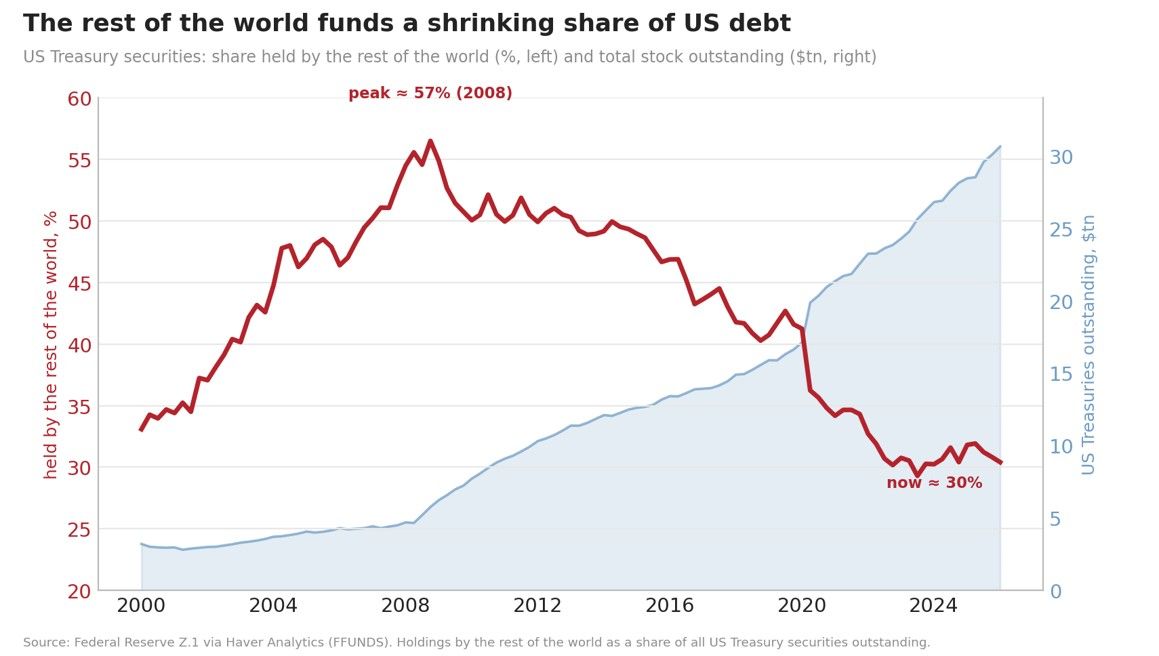
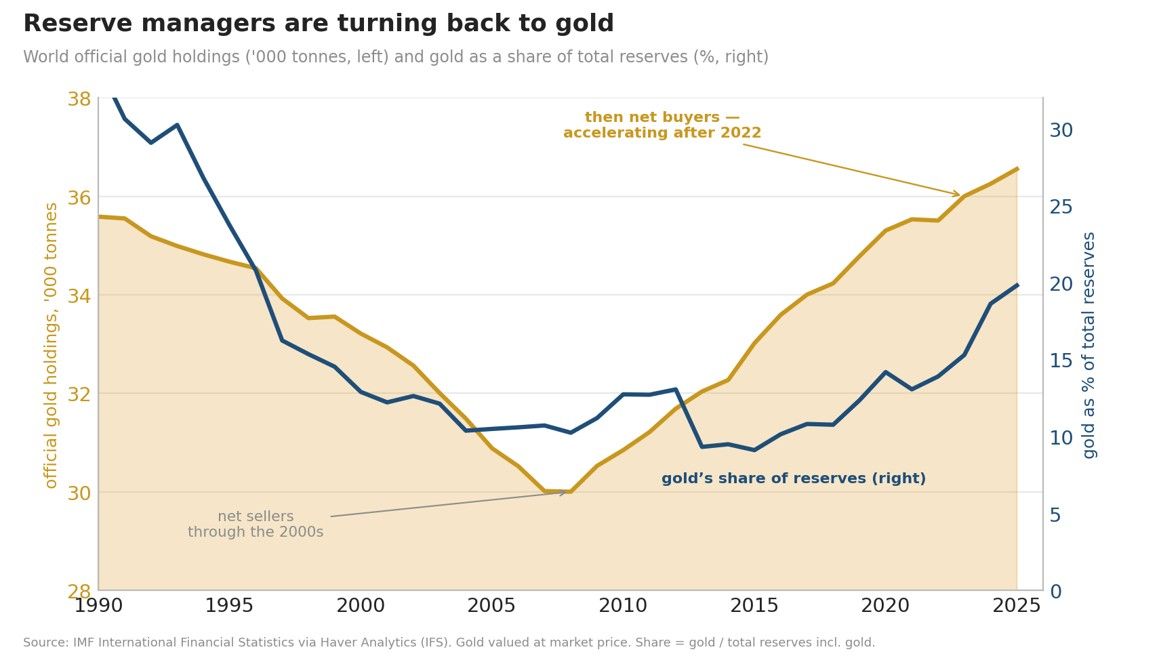
A dominant anxiety in financial markets remains the level of long-term interest rates. It is worth beginning, though, with the real economy, where the news of recent days has been more reassuring. Haver’s proprietary calculation of world GDP growth suggests the global economy held up well in the second quarter, expanding at close to its long-run average pace and defying the sharper slowdown many had feared (chart 1). The August flash purchasing managers’ indices tell a similar story, with most of the major economies both in expansion and still improving — though, as ever, the composite readings conceal a more uneven picture beneath (chart 2). From South Korea, whose trade figures are among the world’s most timely, comes the same message, and a pointed one about the artificial-intelligence boom: semiconductor exports have continued to surge (chart 3). Yet the market’s gaze stays fixed on US yields, and a decomposition explains why they are being watched so closely — the rise has come overwhelmingly from the real component, not from any meaningful revival of inflation expectations (chart 4). That, one might argue, is not a passing technical matter but a structural one, rooted in who is willing to fund the US government. The rest of the world now funds a steadily shrinking share of its debt (chart 5), and the surplus nations that once recycled their savings into Treasuries are turning, instead, to gold (chart 6). It is against this backdrop that Treasury Secretary Scott Bessent's recent remarks that the government may intervene in the market to support its debt have drawn attention.
Global Growth Held Up in Q2 For all the forecasts of a slowdown, the world economy has refused to oblige. Through a year of tariffs, war and the lagged bite of tighter money, global growth held up well in Q2 at close to its long-run pace (chart below). That resilience is noteworthy. Consumer and companies have absorbed shocks that might once have tipped it over and a reminder that the pressures bearing on some financial markets are coming less from a faltering economy than from somewhere else entirely.
Chart 1: World Real GDP Growth on Haver’s Calculation — Still Close to its Long-Run Average
The Flash PMIs Concur The timelier survey evidence only reinforces the point: the expansion is broad, and in most of the major economies gathering pace (chart below). What matters for the argument that follows is where that momentum originates. This is not just a consumer-led, services-driven upswing that had been the norm of recent years. It is being driven, in many parts of the world, by industry — the goods-producing side of the economy that builds, equips and invests. Manufacturing has moved to the front of a global revival, with services accompanying— and, in Europe, lagging — rather than setting the pace. That is arguably the signature of a capital-spending cycle taking hold, and a clear real-economy sign that an investment wave is under way.
Chart 2: Composite Flash PMIs in August — Levels versus Three-Month Changes
South Korea Flags the Same Resilience — and the AI Boom South Korea is often regarded as the world economy’s early-warning system, wired as it is into the circuitry of global trade. Its exports confirm that demand is holding up. But the arresting part is semiconductors, where growth has gone almost vertical (chart below). This is the artificial-intelligence boom ceasing to be a story about valuations and becoming one about real, tradable demand: the capital being poured into data centres and computing power is now showing up, in hard numbers, in the trade of the economies that make the chips.
Chart 3: South Korea — First 20 Days’ Exports, Total and Semiconductors (%y/y)
The Market’s Eye Stays on US Yields — and the Real Rate Leads Against so resilient a backdrop, the market’s fixation on US long-term yields can look overwrought. It may not be. What arguably matters is why they are rising: the climb is almost entirely driven by the real rate, not in any great fear (yet) of inflation (chart 4 below). This is not a market fretting too much about inflation; it is a market repricing the cost of capital.
Chart 4: The US 30-Year Real (TIPS) Yield and Five-Year Forward Inflation
Behind It, the World Funds Less of America’s Debt That shift is, in part, about who is willing to fund the United States. For two decades the world’s surplus savers — foreign central banks above all — recycled their reserves into Treasuries almost automatically, and asked little in return. That era is now passing (chart below). As the official buyer steps back, the task of financing an ever-larger debt falls to private investors who will hold it only if paid to, and (as now), possibly paid more.
Chart 5: The Rest of the World Funds a Shrinking Share of US Debt
And the Surplus Nations Turn to Gold If not into American debt, where is the world's surplus going? Increasingly into gold, and our final chart shows the scale of the shift already under way. The motive is straightforward: the freezing of Russia's reserves in 2022 demonstrated that dollar claims carry a political risk that gold does not — a reserve is secure only so long as its holder remains on good terms with the issuing government. The accumulation of gold and the retreat from Treasuries are two aspects of a single reallocation, as reserve managers move their surpluses out of assets they no longer regard as unconditionally safe. For the cost of Western capital, it is a further and durable source of upward pressure.
Chart 6: Reserve Managers Are Turning Back to Gold

Andrew Cates
AuthorMore in Author Profile »Andy Cates joined Haver Analytics as a Senior Economist in 2020. Andy has more than 25 years of experience forecasting the global economic outlook and in assessing the implications for policy settings and financial markets. He has held various senior positions in London in a number of Investment Banks including as Head of Developed Markets Economics at Nomura and as Chief Eurozone Economist at RBS. These followed a spell of 21 years as Senior International Economist at UBS, 5 of which were spent in Singapore. Prior to his time in financial services Andy was a UK economist at HM Treasury in London holding positions in the domestic forecasting and macroeconomic modelling units. He has a BA in Economics from the University of York and an MSc in Economics and Econometrics from the University of Southampton.
More Economy in Brief