 Global| May 10 2005
Weekly Chain Store Sales Up Again
by:Tom Moeller
|in:Economy in Brief
Summary
Chain store sales opened the month of May with a 0.7% rise which added to the 0.5% increase of the prior week, according to the International Council of Shopping Centers (ICSC)-UBS survey. The increase raised the level of sales 1.4% [...]
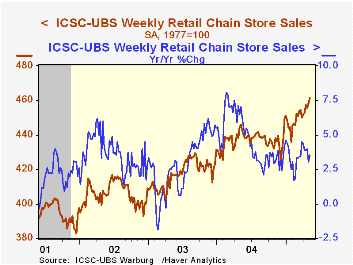
Chain store sales opened the month of May with a 0.7% rise which added to the 0.5% increase of the prior week, according to the International Council of Shopping Centers (ICSC)-UBS survey. The increase raised the level of sales 1.4% versus April when they rose 0.6% from March.
During the last ten years there has been a 56% correlation between the y/y change in chain store sales and the change in non-auto retail sales less gasoline, as published by the US Census Department. Chain store sales correspond directly with roughly 14% of non-auto retail sales less gasoline.
The leading indicator of chain store sales from ICSC fell 0.4% (-1.2% y/y) during the final week of April.
The ICSC-UBS retail chain-store sales index is constructed using the same-store sales (stores open for one year) reported by 78 stores of seven retailers: Dayton Hudson, Federated, Kmart, May, J.C. Penney, Sears and Wal-Mart.
| ICSC-UBS (SA, 1977=100) | 05/07/05 | 04/30/05 | Y/Y | 2004 | 2003 | 2002 |
|---|---|---|---|---|---|---|
| Total Weekly Chain Store Sales | 461.4 | 458.0 | 3.5% | 4.6% | 2.9% | 3.6% |
by Tom Moeller May 10, 2005
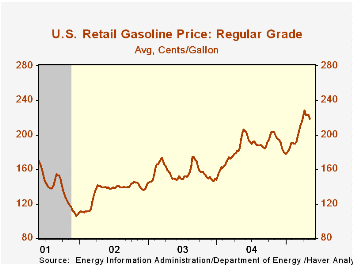
In the US, the average price for unleaded regular gasoline eased to $2.19 per gallon last week, down for the fourth consecutive week and off 4.1% from the peak of $2.28.
As of March, the price of gasoline had risen 83.3% versus the low in late 2001. Relative to non-energy prices in the CPI, gasoline prices rose 72.0% during the period.
Mitigating the economic impact of these gains is the 50% decline in the ratio of petroleum usage versus US real GDP during the last thirty years.
The price of oil also fell last week. West Texas Intermediate crude dropped to $52.04 per barrel versus the earlier high of $57.28.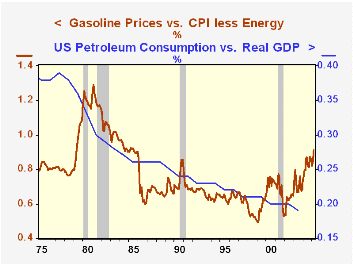
Wholesale natural gas prices slipped to $6.56/mmbtu (+8.8% y/y), down 8.5% from the April average.
For the latest Short Term Energy Outlook from the US Department of Energy click here.
| Energy Prices | 05/09/05 | 12/31/04 | Y/Y | 2004 | 2003 | 2002 |
|---|---|---|---|---|---|---|
| US Retail Gasoline, Regular ($/Gal.) | $2.19 | $1.79 | 12.6% | $1.85 | $1.56 | $1.35 |
| Domestic Spot Market Price: West Texas Intermediate ($/Barrel) | $52.04 | $41.78 | 33.7% | $41.78 | $32.78 | $31.23 |
by Louise Curley May 10, 2005

German exports, seasonally adjusted, rose 2.1%, in March after having declined by almost 3% in February. At the same time imports declined 1.2%. As a result, the balance of trade rose by 2.9 billion euros to 15.1 billion euros, an all time peak. Chart 1 shows Germany's balance of trade in goods.
The improvement in the balance of trade in goods has favorable implications for growth in the economy. Exports have been the one bright spot in the German economy and have accounted for most of what little growth the economy has shown. Imports, of course, affect GDP negatively, and the rising cost of oil has muted the positive influence of exports. Chart 2 shows the effect of rising oil prices over the last year on Germany's imports of crude oil and gas imports. While the imports of crude oil and gas have dropped in the first two months of this year, the price of oil remains a risk to the outlook.
In the table below we show both the seasonally adjusted and the non seasonally adjusted data. Strictly speaking, the percentage change from one period to the next should be calculated on the basis of seasonally adjusted data. In the absence of seasonal adjustments, the most meaningful percentage change is that of one period to the same period in the previous year. In its press release the Federal Statistical Office of Germany reports percentage changes in this manner.
| Germany | Mar 05 | Feb 05 | Mar 04 | M/M% | Y/Y% | 2004 | 2003 | 2002 |
|---|---|---|---|---|---|---|---|---|
| Exports (SA Bil Euros) | 62.7 | 61.5 | 59.0 | 2.1 | 725.5 | 666.9 | 654.5 | |
| Imports (SA Bil Euros) | 47.9 | 48.24 | 44.62 | -1.2 | 570.3 | 535.9 | 520.2 | |
| Balance (SA Bil Euros) | 15.1 | 13.2 | 14.4 | 1.9 | 155.2 | 131.01 | 134.3 | |
| Exports (NSA Bil Euros) | 65.3 | 59.7 | 64.7 | 0.9 | 733.2 | 664.43 | 651.32 | |
| Imports (NSA Bil Euros) | 49.0 | 46.2 | 48.1 | 1.9 | 577.1 | 534.5 | 518.5 | |
| Balance (NSA Bil Euros) | 16.3 | 13.5 | 16.6 | -3.0 | 156.1 | 130.0 | 132.8 |

Tom Moeller
AuthorMore in Author Profile »Prior to joining Haver Analytics in 2000, Mr. Moeller worked as the Economist at Chancellor Capital Management from 1985 to 1999. There, he developed comprehensive economic forecasts and interpreted economic data for equity and fixed income portfolio managers. Also at Chancellor, Mr. Moeller worked as an equity analyst and was responsible for researching and rating companies in the economically sensitive automobile and housing industries for investment in Chancellor’s equity portfolio. Prior to joining Chancellor, Mr. Moeller was an Economist at Citibank from 1979 to 1984. He also analyzed pricing behavior in the metals industry for the Council on Wage and Price Stability in Washington, D.C. In 1999, Mr. Moeller received the award for most accurate forecast from the Forecasters' Club of New York. From 1990 to 1992 he was President of the New York Association for Business Economists. Mr. Moeller earned an M.B.A. in Finance from Fordham University, where he graduated in 1987. He holds a Bachelor of Arts in Economics from George Washington University.
More Economy in Brief


