 Global| May 12 2021
Weak March Base Helps to Drive EMU IP Higher
Summary
IP data and trends in Europe and the EMU remain mixed. While consumer spending data are showing a clear trend to rebound, the output data can’t be said to be there. But they do seem to be on the verge. In the EMU, manufacturing in the [...]
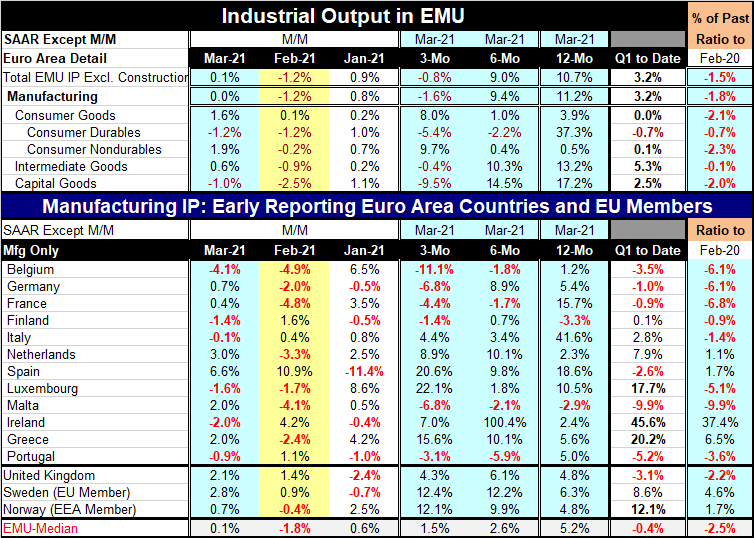
 IP data and trends in Europe and the EMU remain mixed. While consumer spending data are showing a clear trend to rebound, the output data can’t be said to be there. But they do seem to be on the verge. In the EMU, manufacturing in the 12 EMU members in the table fell in six and rose in six, pretty much a trend stand-off. Over three months, the split is also 6 vs. 6; over six months, four countries show output declines and eight show increases; over 12 months, only two countries show output declines.
About the EMU progressions
The longer trends more reliably show output gains, but that effect stems from the fact that these are March data and as the base for the growth calculation goes back beyond three-months to six-months and 12-months that base drops in value and becomes embedded in the period of severe virus stress for the economies. And so compared to that, things look more solid. But as far as making the trend stronger, well, that fails to be convincing.
Country progressions outside EMU
The progression of growth also has to do with economic conditions in the EMU itself, not just stresses induced by the virus. The table also shows three non-EMU members. The countries the U.K., Sweden and Norway, show increases for each country in March. And all three countries show output increases in each over three months, six months, and 12 months. Two of the three countries show output on accelerating trends; the third shows output on a varying but more steady growth plane.
Quarter-to-date
In the quarter-to-date, half the EMU nations are showing output contractions with the other half posting increases. Other Europe shows Q1 output higher in two of its three countries.
Output relative to pre-virus
Taking output back to February just before Covid-19 struck hard, only four EMU members show output is above February levels in March 2021 (Netherlands, Spain, Ireland and Greece). Other Europe shows output higher in two of its three reporters.
Output by sector
By sector, consumer goods output is strong rising by 3.9% over 12 months and at an 8% annualized rate over three months. That strength is led by output in the nondurable goods sector. Trends in consumer durable goods output are actually contracting at an accelerating pace from 12-months to six-months to three-months. Intermediate goods output also deteriorates on the timeline starting with double-digit growth over 12 months and six months then sinking into contraction over three months. Capital goods follows the same trend as for intermediate goods but logs a far larger contraction over three months.
Sector overview vs. country trends
The sector data on IP trends is disturbing as it suggests that economic conditions are winding down and not improving at all. The country data follow much the same pattern but resolve themselves in mixed trends for the most current data. For both country and sector trends, the calendar and the virus appear to the driving forces since the position of the base for any growth calculation appears to be more important that the action from the most recent month’s change.
Quarter-to-date by sector and comparison to pre-virus
In the case of quarter-to-date output trends from sectors, the data show output increases proliferate except for consumer durable goods and that is enough to drive overall consumer goods output to zero on the quarter. Still, that permits overall output to rise at a 3.2% annual rate in Q1 2021. Output logs a solid increase in the quarter despite the wobbling in recent months. Despite that, output, when monthly levels are compared to February of last year before the virus struck, is lower in each sector category. Intermediate goods are the closest to being dug out as output is lower in this time sequence by only 0.1%. But nondurable goods output and capital goods output are each lower by 2% or more as of March.
Summing up
The results that IP shows demonstrate that the industrial sector continues to struggle even though it seems to be doing much better when we look at PMI responses. Output is struggling especially for consumer goods and capital goods. Across countries we see output mixed over March and in the first quarter of 2021. While output rises in three of the four largest EMU economics in March, it falls hard in the two largest EMU economies over three months. Solid economic performance has yet to assert itself in the EMU. But with vaccines in play and vaccinations spreading, the future looks brighter even if it is not apparent in the trends just yet.

Robert Brusca
AuthorMore in Author Profile »Robert A. Brusca is Chief Economist of Fact and Opinion Economics, a consulting firm he founded in Manhattan. He has been an economist on Wall Street for over 25 years. He has visited central banking and large institutional clients in over 30 countries in his career as an economist. Mr. Brusca was a Divisional Research Chief at the Federal Reserve Bank of NY (Chief of the International Financial markets Division), a Fed Watcher at Irving Trust and Chief Economist at Nikko Securities International. He is widely quoted and appears in various media. Mr. Brusca holds an MA and Ph.D. in economics from Michigan State University and a BA in Economics from the University of Michigan. His research pursues his strong interests in non aligned policy economics as well as international economics. FAO Economics’ research targets investors to assist them in making better investment decisions in stocks, bonds and in a variety of international assets. The company does not manage money and has no conflicts in giving economic advice.
More Economy in Brief


