 Global| Aug 30 2006
US GDP Growth Revised Up, Profit Growth Slowed
by:Tom Moeller
|in:Economy in Brief
Summary
U.S. real GDP growth during 2Q '06 was revised higher to 2.9% (AR) from the advance report of 2.5% growth. The figure about matched Consensus expectations for a 3.0% rise. Reported for the first time, 2Q profits advanced 3.2% (20.5% [...]
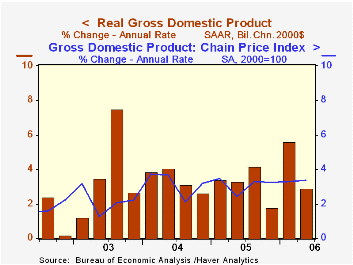
U.S. real GDP growth during 2Q '06 was revised higher to 2.9% (AR) from the advance report of 2.5% growth. The figure about matched Consensus expectations for a 3.0% rise.
Reported for the first time, 2Q profits advanced 3.2% (20.5% y/y), far slower than the double digit increases during the prior two quarters. Profits at U.S. nonfinancial corporations grew just 0.6% (15.6% y/y), after an 11.6% surge during 1Q and financial corporate profits grew 7.8% (27.8% y/y). Earnings of overseas corporations posted a 4.0% (27.0% y/y) increase.
Growth in final sales to domestic purchasers was little revised at 1.7% (3.0% y/y) following four quarters of 3.7% growth.
Growth in business fixed investment was revised somewhat higher to a still-slowed 4.7% (7.3% y/y) rate. Spending on equipment & software continued to show a decline of 1.6% (+6.8% y/y), much of it in spending on transportation equipment, but growth in structures spending ramped up to 22.1% (8.4% y/y).
The advance in real personal consumption expenditures held at a little revised 2.6% versus 3.4% during the prior four quarters. Durables spending grew 0.4% (3.6% y/y) as motor vehicles & parts fell 0.8%, less than initially estimated.
The decline in residential investment was deepened to 9.8% (-1.2% y/y) and that reduced 2Q GDP growth by 0.6 percentage points.
Real spending by the federal government fell 4.3% (+2.1% y/y), a decline which subtracted 0.3 percentage points from GDP growth.A stronger contribution from inventories added 0.6 percentage points to GDP growth, revised from 0.4 points. Meanwhile, an improved net export deficit added a little-revised 0.4 percentage points to growth as exports grew 5.1% (7.9% y/y) and imports rose 0.6% (6.2% y/y).
The rise in the GDP chain price index was unrevised at 3.3%, the fourth straight quarter at that rate, though the domestic final sales price deflator grew 4.0% (3.7% y/y). Less food & energy consumer prices rose 2.8% (2.3% y/y), initially reported at 2.9%.
The minutes of the latest FOMC meeting can be found here
Income, Poverty and Health Insurance in the United States: 2005 from the U.S. Census Bureau is available here.
| Chained 2000$, % AR | 2Q '06 (Prelim.) | 2Q '06 (Advance) | 1Q '06 | Y/Y | 2005 | 2004 | 2003 |
|---|---|---|---|---|---|---|---|
| GDP | 2.9% | 2.5% | 5.6% | 3.5% | 3.2% | 3.9% | 2.5% |
| Inventory Effect | -- | 0.4% | -0.0% | 0.6% | -0.3% | 0.4% | 0.0% |
| Final Sales | -- | 2.1% | 5.6% | 2.9% | 3.5% | 3.5% | 2.5% |
| Foreign Trade Effect | -- | 0.3% | -0.0% | -0.1% | -0.1% | -0.5% | -0.3% |
| Domestic Final Demand | -- | 1.6% | 5.4% | 3.0% | 3.6% | 4.0% | 2.8% |
| Chained GDP Price Index | -- | 3.3% | 3.3% | 3.3% | 3.0% | 2.8% | 2.1% |
by Tom Moeller August 30, 2006
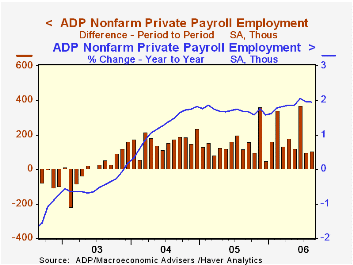
The Nat'l Employment Report, published by the payroll processor ADP, indicated that August private nonfarm payrolls rose 107,000. The August figure from BLS will be published this Friday.
The rise in ADP's measure of July private nonfarm payrolls of 99,000 was accompanied by a 113,000 rise in private nonfarm payrolls as published by the Bureau of Labor Statistics.
ADP has compiled the estimate from its database of individual companies' payroll information. Macroeconomic Advisers, LLC, the St. Louis economic consulting firm, developed the methodology for transforming the raw data into an economic indicator.
According to ADP and Macro Advisers, the correlation between the monthly percentage change in the ADP estimate and that in the BLS data is 0.90.
The ADP National Employment Report data is maintained in Haver's USECON database; historical data go back to December 2000. The figures in this report cover only private sector jobs and exclude employment in the public sector, which grew an average of 11,333 per month over the last year.
The full ADP National Employment Report can be found here, and the ADP methodology is explained here.
| LAXEPA@USECON | Aug | July | Y/Y | 2005 | 2004 | 2003 |
|---|---|---|---|---|---|---|
| Nonfarm Private Payroll Employment (Chg.) | 107,000 | 99,000 | 1.9% | 1.7% | 1.3% | -0.4% |
by Tom Moeller August 30, 2006
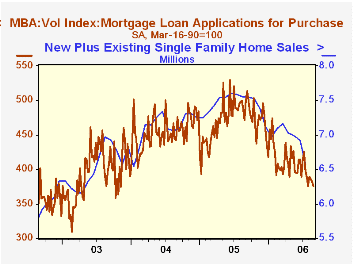
The total number of mortgage applications slipped another 0.9% last week according to the Mortgage Bankers Association. The average level of applications in August rose 2.9% from July.
Last week's decline was led by a 1.6% drop in purchase applications and applications are down 17.8% from the weekly high in January. It was sixth decline in the last seven weeks and lowered purchase apps in August 3.5% below the July average. That was the fourth consecutive m/m decline.
During the last ten years there has been a 58% correlation between the y/y change in purchase applications and the change in new plus existing single family home sales.
Applications to refinance were roughly unchanged w/w and rose 13.3% in August versus July.
The effective interest rate on a conventional 30-year mortgage was about unchanged at 6.60% versus 6.58% the prior week. The peak for 30 year financing was 7.08% late in June. The rate on 15-year financing also remained unchanged at 6.32% and the peak rate was 6.75%. Interest rates on 15 and 30 year mortgages are closely correlated (>90%) with the rate on 10 year Treasury securities.
During the last ten years there has been a (negative) 79% correlation between the level of applications for purchase and the effective interest rate on a 30-year mortgage.
The Mortgage Bankers Association surveys between 20 to 35 of the top lenders in the U.S. housing industry to derive its refinance, purchase and market indexes. The weekly survey accounts for more than 40% of all applications processed each week by mortgage lenders. Visit the Mortgage Bankers Association site here.
| MBA Mortgage Applications (3/16/90=100) | 08/25/06 | 08/18/06 | Y/Y | 2005 | 2004 | 2003 |
|---|---|---|---|---|---|---|
| Total Market Index | 556.5 | 561.5 | -23.0% | 708.6 | 735.1 | 1,067.9 |
| Purchase | 375.9 | 382.2 | -20.1% | 470.9 | 454.5 | 395.1 |
| Refinancing | 1,609.2 | 1,608.5 | -26.4% | 2,092.3 | 2,366.8 | 4,981.8 |
by Carol Stone August 30, 2006
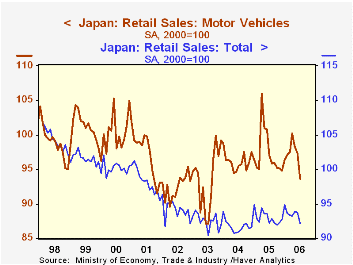
Retail sales data were reported today for four very different economies. While "globalization" may be bringing many aspects of the world economy closer together, these reports indicate that people's shopping behavior varies widely from place to place.
In Japan, sales were off 1.7% in July from June, and remained marginally under the year-ago volume. As seen in the graph, the best we can say for Japan's retailing sector is that it is stabilizing after a protracted period of decline. We are all pleased with the growth that is developing in Japan overall, but consumers seem not yet to be participating. Louise Curley also made this point yesterday in her discussion of the monthly survey on households' living expenditures. Among the retail sales segments, there is some slight growth in food, and clothing has been flat since late 2003. Downtrends are still evident at general merchandise stores and household furnishings. Motor vehicle dealers saw lower sales in July, after a basically trendless period since early 2004.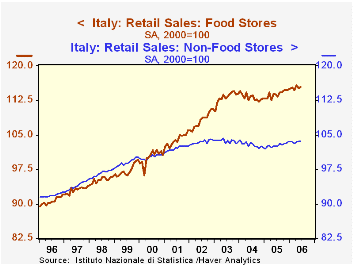
Retail sales are also fairly slow in Italy, hovering in a narrow band the past three years. In June, total sales were up a mere 0.1% from May and 1.3% from the year before. We admit to being mildly amused that the greatest strength among Italian retailers is at supermarkets and other food stores. It's good to know Italians enjoy Italian food as much as the rest of us do. Non-food stores' sales are lagging, however.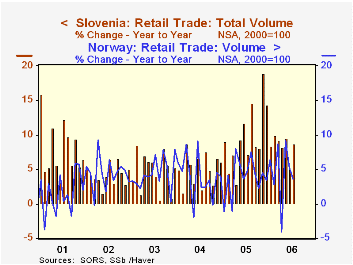
Two smaller European countries are seeing good growth in retail sales. In Norway, they were up 0.6% in July, after falling 0.8% in June. But they are up 3.6% from July 2005 and the longer-term performance shows an annualized pace of 4.6% over the past five years. In Slovenia, the growth is stronger still: 8.7% from one year ago and a 5.6% average rate of change from five years ago. Available detail indicates that Slovenians are busy buying cars and other vehicles and fueling and servicing them; those sales ran a sizable 17% above a year ago in volume terms. Standard "retail trade" stores report growth from the year ago of 2%.
| Indexes, 2000=100, Seas Adj | July 2006 | June 2006 | May 2006 | Year Ago | 2005 | 2004 | 2003 |
|---|---|---|---|---|---|---|---|
| Japan | 92.1 | 93.7 | 93.8 | 92.2 | 93.0 | 91.7 | 92.5 |
| Italy | -- | 108.3 | 108.2 | 107.0 | 107.3 | 106.9 | 107.3 |
| Norway | 126.16 | 125.41 | 126.46 | 119.53 | 119.34 | 114.53 | 110.68 |
| Slovenia (NSA) | 147.4 | 149.7 | 148.6 | 135.6 | 135.2 | 123.3 | 117.4 |

Tom Moeller
AuthorMore in Author Profile »Prior to joining Haver Analytics in 2000, Mr. Moeller worked as the Economist at Chancellor Capital Management from 1985 to 1999. There, he developed comprehensive economic forecasts and interpreted economic data for equity and fixed income portfolio managers. Also at Chancellor, Mr. Moeller worked as an equity analyst and was responsible for researching and rating companies in the economically sensitive automobile and housing industries for investment in Chancellor’s equity portfolio. Prior to joining Chancellor, Mr. Moeller was an Economist at Citibank from 1979 to 1984. He also analyzed pricing behavior in the metals industry for the Council on Wage and Price Stability in Washington, D.C. In 1999, Mr. Moeller received the award for most accurate forecast from the Forecasters' Club of New York. From 1990 to 1992 he was President of the New York Association for Business Economists. Mr. Moeller earned an M.B.A. in Finance from Fordham University, where he graduated in 1987. He holds a Bachelor of Arts in Economics from George Washington University.
More Economy in Brief


