 Global| Feb 25 2005
US GDP Growth Revised Up
by:Tom Moeller
|in:Economy in Brief
Summary
US real GDP growth in 4Q04 was revised up to 3.8% (AR), about the same rate of growth as in the prior quarter. The Consensus expectation had been for 3.6% growth in 4Q. Trade sector deterioration is now estimated to have subtracted [...]
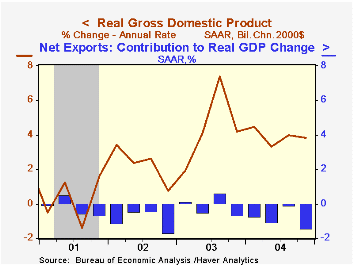
US real GDP growth in 4Q04 was revised up to 3.8% (AR), about the same rate of growth as in the prior quarter. The Consensus expectation had been for 3.6% growth in 4Q.
Trade sector deterioration is now estimated to have subtracted less from GDP growth; 1.43 percentage points versus 1.73 points estimated earlier. Statistics Canada corrected a $1.4B underestimation of U.S. exports to Canada during November. The correction contributed to a revision in total US goods exports to a 1.9% rate of growth (6.6% y/y) from -6.8% estimated in the advance report. Imports of goods rose 15.3% (11.4% y/y), revised from 12.2%.
An upward revision to inventory accumulation indicated that production increases to raise inventories added 0.6 percentage points to GDP growth versus 0.4 percentage points estimated earlier.
Domestic demand growth also was revised up slightly to 4.5% as growth in business fixed investment in equipment & software was raised to 18.0% (14.4% y/y) from 14.9%. Residential investment growth also was raised to 2.1% (6.2% y/y) from 0.3% but growth in PCE was lowered to 4.2% (3.7% y/y) from 4.6%.
Price inflation was revised up slightly to 2.1%. The price index for domestic demand grew 2.7% (2.9% y/y) driven by an upwardly revised 5.4% (4.9% y/y) increase in the state & local government price index.
Corporate profits for 4Q will be released on March 30th and will incorporate the effects of thespecial dividend paid to shareholders by Microsoft Corporation.
The Reform of 1979: How It Happened and Why is from the Research & Statistics and Monetary Affairs Division of the US Federal Reserve Board.
| Chained 2000$, % AR | 4Q '04 (Prelim. | 4Q '04 (Advance) | 3Q '04 | Y/Y | 2004 | 2003 | 2002 |
|---|---|---|---|---|---|---|---|
| GDP | 3.8% | 3.1% | 4.0% | 3.9% | 4.4% | 3.0% | 1.9% |
| Inventory Effect | 0.6% | 0.4% | -1.0% | 0.4% | 0.4% | -0.1% | 0.4% |
| Final Sales | 3.2% | 2.7% | 5.0% | 3.5% | 4.0% | 3.1% | 1.4% |
| Trade Effect | -1.4% | -1.7% | -0.1% | -0.7% | -0.4% | -0.3% | -0.7% |
| Domestic Final Demand | 4.5% | 4.3% | 4.9% | 4.2% | 4.4% | 3.4% | 2.1% |
| Chained GDP Price Index | 2.1% | 2.0% | 1.4% | 2.4% | 2.2% | 1.8% | 1.7% |

Tom Moeller
AuthorMore in Author Profile »Prior to joining Haver Analytics in 2000, Mr. Moeller worked as the Economist at Chancellor Capital Management from 1985 to 1999. There, he developed comprehensive economic forecasts and interpreted economic data for equity and fixed income portfolio managers. Also at Chancellor, Mr. Moeller worked as an equity analyst and was responsible for researching and rating companies in the economically sensitive automobile and housing industries for investment in Chancellor’s equity portfolio. Prior to joining Chancellor, Mr. Moeller was an Economist at Citibank from 1979 to 1984. He also analyzed pricing behavior in the metals industry for the Council on Wage and Price Stability in Washington, D.C. In 1999, Mr. Moeller received the award for most accurate forecast from the Forecasters' Club of New York. From 1990 to 1992 he was President of the New York Association for Business Economists. Mr. Moeller earned an M.B.A. in Finance from Fordham University, where he graduated in 1987. He holds a Bachelor of Arts in Economics from George Washington University.
More Economy in Brief


