 Global| Oct 31 2007
US GDP Growth Boosted Again by Improved Trade Deficit
by:Tom Moeller
|in:Economy in Brief
Summary
U.S. real GDP growth last quarter of 3.9% (AR), in the advance report from the Commerce Department, was higher than expectations for 3.2% growth. The contribution to growth from net export improvement was another 0.9 percentage points [...]

U.S. real GDP growth last quarter of 3.9% (AR), in the advance report from the Commerce Department, was higher than expectations for 3.2% growth.
The contribution to growth from net export improvement was another 0.9 percentage points after the 1.3 percentage point contribution during 2Q. Exports boomed at a 16.2% annual rate (9.6% y/y) while import growth of 5.2% (2.9% y/y) reflected the slowdown in U.S. final demand growth.
Growth in final sales to domestic purchasers at 2.5% (AR) wasn't bad following 2.1% 2Q growth and 1.7% growth in 1Q, but the likely increase for all of this year around 2.0% will lag last year's advance of 2.7% and 3.3% in 2004.
The shortfall in domestic demand growth was led by a whopping 20.1% AR (-16.4% y/y) decline in residential investment. It was near the top quarterly rate of decrease during this down cycle in the housing sector.
Firm growth in business fixed investment was again a mainstay of overall domestic demand. It rose 7.9% AR (4.8% y/y) rate after an 11.0% surge in 2Q. Spending on structures, in late cycle fashion, led that increase and rose 12.4% AR (12.8% y/y). Spending on equipment & software also was firm at 5.9% (AR), the strongest since 1Q '06, but the y/y gain of 1.4% was reduced by weak growth or q/q declines from 2Q '06 to 1Q '07.
Growth in real personal consumption expenditures also wasn't bad at 3.0% (3.0% y/y) which was double growth during 2Q. Growth in spending on durable goods amounted to 4.4% (4.7% y/y) as 11.8% growth in spending on furniture & appliances offset a 5.4% drop in spending on motor vehicles. Spending on other durable goods boomed at an 11.7% rate. Nondurable goods spending turned in a 2.7% (2.4% y/y) advance and services spending growth was steady at 2.9% (3.0% y/y).Inventories added just 0.4 percentage points to GDP growth after a 0.2 point contribution during 2Q. That contribution has been negative this year.
The GDP chain price index rose just 0.8% led by declines in both the nonresidential and residential price indexes. Consumer prices rose only 1.7%, held back by the decline in gasoline prices, while less food & energy it rose just 1.8% (1.9% y/y).


| Chained 2000$, % AR | 3Q ' 07 Advance | 2Q '07 | Y/Y | 2006 | 2005 | 2004 |
|---|---|---|---|---|---|---|
| GDP | 3.9 | 3.8 | 2.6 | 2.9 | 3.1 | 3.6 |
| Inventory Effect | 0.4 | 0.2 | -0.4 | 0.1 | -0.2 | 0.4 |
| Final Sales | 3.5 | 3.6 | 3.0 | 2.8 | 3.3 | 3.3 |
| Foreign Trade Effect | 0.9 | 1.3 | 0.9 | -0.1 | -0.2 | -0.7 |
| Domestic Final Demand | 2.5 | 2.1 | 2.1 | 2.7 | 3.3 | 3.8 |
| Chained GDP Price Index | 0.8 | 2.6 | 2.3 | 2.6 | 1.7 | 2.1 |
by Tom Moeller October 31, 2007

The ADP National Employment Report, reported by the payroll processor, found that private nonfarm payrolls rose a much improved 106,000 during October versus a 61,000 rise during September.
The U.S. Bureau of Labor Statistics employment figure for October will be published this Friday.
Last month, ADP's measure of private nonfarm payrolls for September indicated an upwardly revised 61,000 increase in jobs that was followed by a 73,000 increase in private nonfarm payrolls.
The sub-index for small payrolls, rose 63,000.
The sub-index for large payrolls, conversely, fell 7,000.
According to ADP and Macro Advisers, the correlation between the monthly percentage change in the ADP estimate and that in the BLS data is 0.90.
ADP compiled the estimate from its database of individual companies' payroll information. Macroeconomic Advisers, LLC, the St. Louis economic consulting firm, developed the methodology for transforming the raw data into an economic indicator.
The ADP National Employment Report data is maintained in Haver's USECON database; historical data go back to December 2000. The figures in this report cover only private sector jobs and exclude employment in the public sector, which rose an average 11,083 during the last twelve months.
The full ADP National Employment Report can be found here, and the ADP methodology is explained here.
| LAXEPA@USECON | October | September | Y/Y | 2006 | 2005 | 2004 |
|---|---|---|---|---|---|---|
| Nonfarm Private Payroll Employment (m/m Chg.) | 106,000 | 61,000 | 1.0% | 1.7% | 1.8% | 1.3% |
by Robert Brusca October 31, 2007
EU readings still strong…but countries and sectors are slowing
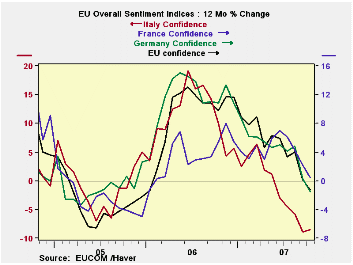
The accompanying chart shows the diminished lift in the
aggregate EU sentiment index and the same result for the largest EMU
nations. Only France is still showing Yr/Yr gains in sentiment; the
rest have crossed the line to reveal Yr/Yr contraction. Not
surprisingly Italy, probably the least competitive of the large EMU
countries, is showing the sharpest contraction. Surprisingly France is
the most resilient, but the chart also tells why. France did not enjoy
the same degree of upswing that the others did. The EU and EMU members
plotted had Yr/Yr gains of 12% or more at some point. France’s peak
Yr/Yr gain came later and only amounted to 8%. In this way France seems
to be a laggard that is prospering off the growth of others. That
suggests that France’s decline will come later too. It does not promise
that France’s decline when it comes will be shallower.
The top panel in the table below shows the relative strength
of the individual sectors within EU. Construction is the relative
strongest in that it is at the highest relative point in its own range
at the 93.3 percentile. That is followed by the industrial and retail
sectors at about a percentile reading of 85, consumer confidence at
75.9 and services at 65.8.
In terms of the major EMU nations plus the UK, France as we
saw above is the relative strongest in EMU but, standing in the 88th
percentile of its range, the non-EMU UK is stronger still. The EMU
itself stands in the 73rd percentile of its range and the other major
EMU countries are below that with Germany in the 63rd percentile, Italy
in the 61st and Spain in the 50th. Over the last four months all of
these are showing slippage. Europe is slowing down. Is it the strong
euro or something else? With the spike in the inflation is the ECB
still going to hikes rates? All interesting questions to stay in touch
with, aren’t they?
| EU Sectors and Country level Overall Sentiment | |||||||||||
|---|---|---|---|---|---|---|---|---|---|---|---|
| EU | Oct 07 |
Sep 07 |
Aug 07 |
Jul 07 |
%tile | Rank | Max | Min | Range | Mean | R-SQ w/ overall |
| Overall | 109.5 | 110.6 | 113.1 | 113.3 | 82.9 | 48 | 117 | 74 | 43 | 100 | 1.00 |
| Industrial | 2 | 3 | 5 | 5 | 85.3 | 27 | 7 | -27 | 34 | -7 | 0.89 |
| Consumer Confidence | -5 | -4 | -3 | -2 | 75.9 | 42 | 2 | -27 | 29 | -10 | 0.82 |
| Retail | 2 | 1 | 6 | 5 | 85.2 | 14 | 6 | -21 | 27 | -6 | 0.47 |
| Construction | 0 | 1 | 0 | 0 | 93.3 | 14 | 3 | -42 | 45 | -18 | 0.44 |
| Services | 19 | 19 | 22 | 20 | 65.8 | 61 | 32 | -6 | 38 | 17 | 0.80 |
| % m/m | Based on Level |
Level | |||||||||
| EMU | -0.9% | -2.8% | -0.9% | -0.6% | 73.7 | 70 | 117 | 74 | 44 | 100 | 0.94 |
| Germany | -0.6% | -3.3% | -0.9% | -0.5% | 63.7 | 64 | 121 | 79 | 42 | 100 | 0.62 |
| France | 0.1% | -1.5% | -1.2% | 0.6% | 81.4 | 26 | 119 | 72 | 47 | 100 | 0.80 |
| Italy | -0.2% | -0.8% | -3.0% | -0.9% | 61.5 | 90 | 121 | 72 | 49 | 100 | 0.79 |
| Spain | -2.7% | -3.4% | 1.1% | -0.9% | 50.4 | 178 | 118 | 67 | 50 | 100 | 0.66 |
| Memo: UK | -2.0% | 1.1% | 4.5% | -5.7% | 88.3 | 15 | 119 | 69 | 50 | 101 | 0.39 |
| since 1990 except services (Oct 1996)208 | -count | services: | 126 | -count | |||||||
| Sentiment is an index, sector readings are net balance diffusion measures | |||||||||||
by Robert Brusca October 31, 2007
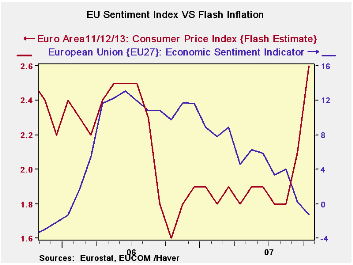
Flash flare does not seem to be part of trend…Wake up call or wrong number?
The survey on flash inflation for the EMU region does not appear to be part of a trend. Indeed with the euro rising, the only real impulse to inflation right now is from commodity prices and since they are priced in dollars even that channel is muted.
The jump in the flash HICP seems to be just a flash in the pan but it’s a pan with explosives in it since the flash has made a huge impact. On a day when the EU Commission indexes show widespread losing in the Euro area and Draghi and Liikanen have made statements about the coming adverse impact on growth. On a totally different track, the BKK’s/ECB’s Weber has cautioned that the pressures on prices could force the ECB to act again to quell rising inflation pressures.
The table below shows the relative trends. There are only three new observations for October for the flash overall rate and the overall rates for German and Italian inflation. For the others, trends derive from prices in September. Through that point there is no solid evidence of inflation spiking or even gradually rising. But Italy and Germany do support the acceleration in the overall rate in October.
There is no core rate to look at to infer what the culprit was in creating price pressures. But there is little evidence of inflation building in the pipeline. In the Euro area 13 both goods and services prices have been pushed to lower rates of increase by the rising euro. For goods the strong euro is at work as the new three-month inflation rate through September is only 0.1% down from inflation in the area of 2% previously. Service sector inflation is at 2.1% for three months up from 2% over six months but down from 2.6% Yr/Yr. In short the 2.6% Euro area flash CPI may be a wake up call but it may also be a wrong number.
| Trends in HICP | |||||||
|---|---|---|---|---|---|---|---|
| % mo/mo | % saar | ||||||
| Oct-07 | Sep-07 | Aug-07 | 3-Mo | 6-Mo | 12-Mo | Yr Ago | |
| EU-13 | #N/A | 0.4% | 0.0% | 1.8% | 2.5% | 2.1% | 1.7% |
| Core | #N/A | 0.2% | 0.2% | 2.1% | 2.0% | 2.0% | 1.5% |
| Goods | #N/A | 1.0% | 0.0% | 0.1% | 2.2% | 1.9% | 1.6% |
| Services | #N/A | -0.5% | 0.2% | 1.8% | 2.5% | 2.5% | 2.0% |
| FLASH - | 0.2% | 0.2% | 0.2% | 2.1% | 2.0% | 2.6% | 1.6% |
| Monthly Flash data are derived from Yr/Yr presentation | |||||||
| HICP | |||||||
| Germany | 0.2% | 0.7% | -0.1% | 3.1% | 2.7% | 2.7% | 1.1% |
| France | #N/A | 0.1% | 0.3% | 1.8% | 2.7% | 1.6% | 1.5% |
| Italy | 0.7% | 0.3% | 0.2% | 4.7% | 3.3% | 2.3% | 1.9% |
| UK | #N/A | 0.1% | 0.1% | -0.4% | 0.6% | 1.7% | 2.4% |
| Spain | #N/A | 0.4% | 0.0% | 2.3% | 2.8% | 2.7% | 2.9% |
| Core Excl Food Energy & A | |||||||
| Germany | #N/A | 0.3% | 0.1% | 2.4% | 2.6% | 2.3% | 0.8% |
| France | #N/A | 0.1% | 0.3% | 2.0% | 2.0% | 1.6% | 1.2% |
| Italy | #N/A | 0.4% | 0.2% | 2.3% | 1.8% | 1.8% | 2.0% |
| UK | #N/A | #N/A | 0.2% | #N/A | #N/A | #N/A | 1.6% |
| Spain | #N/A | 0.2% | 0.3% | 3.0% | 2.7% | 2.6% | 3.0% |
| Blue shaded area data trail by one month | |||||||
by By Robert Brusca October 31, 2007

UK consumer confidence fell in October after dropping sharply in September. The index now resides in the lower 15 percentile of its range - a very poor standing. But the index is not without its paradoxes. Consumers rate their financial situation as the best ever, at the top of its range of responses. But the environment for making major purchases is rated as the worst ever (going back to January 1996).
Over the last 12 months the household financial situation was rated at zero, which garners a percentile standing of 75% - top 25 percentile of its range. But the general economic condition is only rated in the bottom 30%.
Over the next 12 months the financial situation is put at +13 which is a top 15% of range standing. But again the general economic situation is rated much lower, in its 46th percentile below the neutral mark of 50%.
As to income levels the bottom income group and the top group each rate conditions in the bottom 20 percentile of range or worse.
Consumers in the UK are having some fickle moments. But for the most part their assessment of the economy and the period ahead is that the times that lie ahead will not be so good.
| GFK Consumer Survey | ||||||
|---|---|---|---|---|---|---|
| % of 2Yr | % of 10Yr | |||||
| Oct-07 | Sep-07 | Aug-07 | Jul-07 | Range | Range | |
| Consumer Confidence | -8 | -7 | -4 | -6 | 14.3% | 16.7% |
| Current | ||||||
| Household Fin Sit | 25 | 25 | 25 | 25 | 100.0% | 100.0% |
| Major Purchases | -5 | -3 | 4 | -2 | 0.0% | 0.0% |
| Last 12 Months | ||||||
| Household Fin Sit | 2 | 4 | 2 | 0 | 75.0% | 70.0% |
| General Econ Sit | -30 | -29 | -25 | -25 | 29.4% | 29.2% |
| CPI | 69 | 64 | 62 | 66 | 100.0% | 100.0% |
| Savings | 38 | 38 | 42 | 42 | 81.0% | 93.1% |
| Next 12-months | ||||||
| Household Fin Sit | 13 | 12 | 12 | 13 | 85.7% | 85.7% |
| General Econ Sit | -17 | -19 | -15 | -13 | 46.2% | 56.7% |
| Unemployment | 29 | 27 | 29 | 27 | 28.6% | 58.3% |
| Major Purchases | -18 | -20 | -18 | -21 | 62.5% | 29.4% |
| Savings | 19 | 17 | 20 | 17 | 63.6% | 85.2% |
| By Income | ||||||
| Lower | -14 | -13 | -11 | -8 | 20.0% | 12.5% |
| Upper | -3 | -1 | 1 | 0 | 10.0% | 9.1% |
by By Robert Brusca October 31, 2007
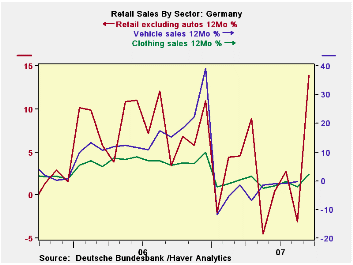
German retail sales rose in September with downward revision to the earlier month showing a strong 2.3% rise in real ex-auto sales. The series is up by 5.1% from one year ago, a pretty good Yr/Yr rise. But in the third quarter this gain still only leaves sales up at a 1.4% annual rate. The revival in sales was across the main retail categories. While the rise of 1.4% in the quarter is not very strong it is in line with what exceptions have been for German retailing where the outlook has been set low all year long.
| German Real and Nominal Retail Sales | ||||||||
|---|---|---|---|---|---|---|---|---|
| Nominal | Sep-07 | Aug-07 | Jul-07 | 3-MO | 6-MO | 12-MO | YrAgo | New QTR Saar |
| Retail Ex auto | 2.6% | -1.3% | 0.6% | 8.2% | 4.8% | 2.4% | 5.6% | 1.7% |
| Motor Vehicle and Parts | #N/A | 3.6% | 0.9% | #N/A | #N/A | #N/A | 15.2% | #N/A |
| Food, Beverages & Tobacco | 3.4% | -1.2% | -0.1% | 8.5% | 4.7% | 1.9% | 5.1% | -0.9% |
| Clothing footwear | 3.4% | 0.2% | 0.2% | 16.0% | 7.3% | 14.0% | 3.4% | 1.4% |
| Real | ||||||||
| Retail Ex auto | 2.3% | -1.6% | 0.7% | 6.0% | 3.0% | 1.4% | 5.1% | 1.4% |
by Carol Stone October 31, 2007
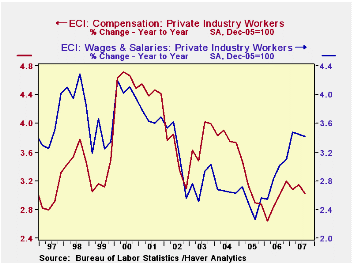
The employment cost index slowed to an 0.8% advance for private industry workers in Q3, compared to 0.9% in Q2 and a Consensus forecast of 0.9%.
Wage and salary growth held at the 0.8% quarterly pace seen in Q2, with the year/year growth also at Q2's amount, 3.4%. Wages account for roughly 70% of the compensation index. The largest recent increase was 1.1% in Q1, driven by outsized increases in several industries.
Benefit costs dropped back from Q2's 1.1% to 0.8%; this put the year/year increase at 2.4%. For the first three quarters this year, the year/year growth rates are the lowest since 1998. This is at least in part due to a more moderate rise in the cost of health benefits, which was up 4.8% y/y again in Q3, the same as in Q2 and less than half the pace of 2002 and 2003.
Compensation costs also eased for state and local government workers. This group saw a rise of 0.8% in Q3, less than 1.1% in Q2 and 1.3% in Q1 and the lowest since Q1 2006. The move was in benefits, which rose "only" 0.7% in Q3, following 1.7% in Q2 and 2.1% in Q1. Wages and salaries actually picked up in Q3 to 1.0% from 0.8% in Q2.

| ECI- Private Industry Workers | 3Q | 2Q | 1Q | Y/Y | 2006 | 2005 | 2004 |
|---|---|---|---|---|---|---|---|
| Compensation | 0.8% | 0.9% | 0.6% | 3.1% | 2.9% | 3.1% | 3.8% |
| Wages & Salaries | 0.8% | 0.8% | 1.1% | 3.4% | 2.9% | 2.5% | 4.7% |
| Benefit Costs | 1.1% | 1.1% | -0.3% | 2.7% | 2.9% | 4.6% | 6.8% |
| ECI- State & Local Government Workers | 0.8% | 1.1% | 1.3% | 4.3% | 3.9% | 3.8% | 3.4% |

Tom Moeller
AuthorMore in Author Profile »Prior to joining Haver Analytics in 2000, Mr. Moeller worked as the Economist at Chancellor Capital Management from 1985 to 1999. There, he developed comprehensive economic forecasts and interpreted economic data for equity and fixed income portfolio managers. Also at Chancellor, Mr. Moeller worked as an equity analyst and was responsible for researching and rating companies in the economically sensitive automobile and housing industries for investment in Chancellor’s equity portfolio. Prior to joining Chancellor, Mr. Moeller was an Economist at Citibank from 1979 to 1984. He also analyzed pricing behavior in the metals industry for the Council on Wage and Price Stability in Washington, D.C. In 1999, Mr. Moeller received the award for most accurate forecast from the Forecasters' Club of New York. From 1990 to 1992 he was President of the New York Association for Business Economists. Mr. Moeller earned an M.B.A. in Finance from Fordham University, where he graduated in 1987. He holds a Bachelor of Arts in Economics from George Washington University.
More Economy in Brief


