 Global| May 02 2007
US Factory Orders Strike Back with Strength...and Against a Statistical Anomaly
Summary
Factory orders struck back in March with an upward revision to durable goods orders and more strength in nondurables than anyone expected. While the three-month growth rate for orders is still severely negative, the outturn for the [...]
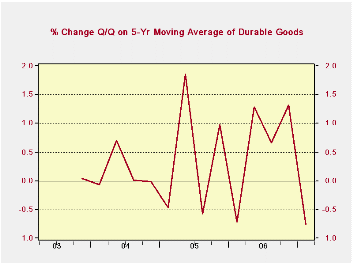
Factory orders struck back in March with an upward revision to durable goods orders and more strength in nondurables than anyone expected. While the three-month growth rate for orders is still severely negative, the outturn for the past two months makes it clear that such a result is temporary. Get December out of the base calculation and three month growth rates will soar....and if we look at durable goods orders alone, the source of most of the movement in factory orders, we find that seasonal adjustment has left us with some curiously consistent patterns in orders that have tended to skew the first quarter into weakness.
The chart on the left shows the results.
To create this chart I have taken a five-year quarterly moving average of each quarter’s orders. This is NOT a five-quarter moving average as one is normally constructed. Rather it is a five-quarter moving average of five years worth of Q1, then of Q2 then of Q3 and so on, by quarter. Q/Q percentage changes are calculated off this base of five year average values, and are extended back in time as well. What emerges is a picture of the average seasonality over the past five years. By comparing each successive ‘four quarter’ pattern, we can see how stable seasonality has been in recent years. Backward moving comparisons drop the recent quarter and add one from farther down the line for each quarter of the year. What the calculations show is that Q1 has tended to be the weak quarter even as the comparisons have shifted their patterns back in time.
What is constant is that Q1 is weak and is therefore NOT representative of the true trend in durable goods orders. Growth rates calculated in Q1 will tend to distort growth downward in the short term.
This result is not an artifact of a few very weak quarters occurring in Q1 due to bad weather or some other spurious factor. If we look at raw Q/Q percentage change data, over the 11 years we can perform this calculation, the first quarter emerges as the weakest in 6 out of 11 years. Since there are four quarters in the year we would expect out of sheer randomness to find Q1 is the weakest of the four quarters about 3 times out of twelve, not six out of eleven. It is emerging as weakest more than twice as often as expected.
Certainly there have been other weak reports in the economy as well as durable goods. But durable goods stick out as something that has been very worrisome and extremely weak not just modestly soft like the ISM readings. And its readings may have biased other measures. Some selected components of orders filter into the index of leading economic indicators. So there is plenty of room for this distortion to have crept into other measures including consumer confidence to say nothing of being fodder for economists looking for something to support their pessimism.
Machinery has been one persistently weak category. But its string of weakness is giving way to some upward momentum. While three month growth rates are weak for machinery across the board, that owes to another distortion, that December tends to be a machinery order high point. That of course will bias lower the three-month growth rate for machinery since December is the base for the three-month calculation in March.
If we look at some machinery categories to see why capital spending has lagged, we find that in March there is a sharp reversal in monthly trends. In Construction machinery, despite ongoing concerns about weakness in US housing, strength is emerging. Engines and turbines, a previously weak category, is also up very sharply in March. Mining and oil field equipment is solidly back in the balance. And, despite ongoing inventory liquidation in the US, material handling equipment more than reversed February’s decline.
On balance we can sift though some of the more detailed data and find a lot of good stories in durable goods.
But if we look ‘top down’ at the seasonal factors we also find a bad story - bad in the sense that it is a story of how we have been mislead by persistently pessimistic orders results early in the year.
With Q1 behind us the orders picture should continue to improve both for statistical reasons and because I think that the economy is doing better. Moreover the weakness in the dollar should be helping US equipment manufactures and exports. For a lot of these equipment makers the question is not just what is the demand in the US but what is global demand. And global demand is still looking pretty solid. We know that US manufacturing has been through a tough patch. But we expect it to pull out, helped by foreign demand and also by the fact that it wasn’t in as big a hole as it seemed.
| Factory Orders | 3Mo | 6Mo | 9Mo | 12Mo | YearAgo |
| Shipments | -2.9% | 1.8% | -3.6% | -0.5% | 5.7% |
| New Orders | -5.6% | -4.5% | -2.4% | -1.3% | 10.7% |
| Unfilled Orders | 13.7% | 18.7% | 20.9% | 19.8% | 20.9% |
| Inventories | 0.9% | 2.0% | 4.0% | 5.7% | 2.9% |
by Carol Stone May 2, 2007
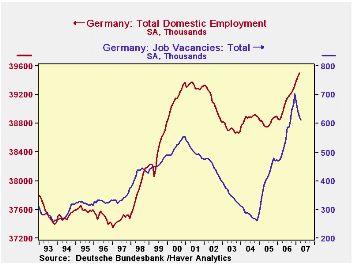
Employment in Germany rose 52,000 in March, following gains of 46,000 and 76,000 in February and January, respectively. This was the 13th consecutive monthly increase in employment, bringing it up 1.5% (annualized) from February 2006. By comparison over the same period, US employment rose 1.9% (comparable "household" survey) but 0.5% in the UK and -- through Q4 2006 -- 0.9% in France. So German employment growth is quite vigorous by its neighbors' standards. Separate data on job vacancies shows some decline in most recent months, but these openings are more plentiful than a year ago, suggesting that employment might go up still further. 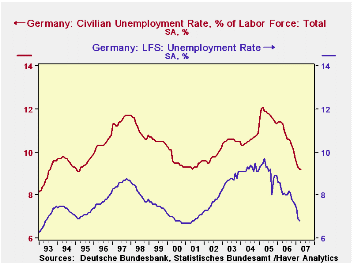
By the same token, unemployment is falling markedly. The ILO definition, used throughout the Eurozone, puts the rate at 6.8% in March, down 1.5 points from the year-ago level and the lowest since April 2001. The locally preferred "registered" unemployment rate was 9.2% in April, sharply lower than 11.3% in April 2006. The latest figure is the lowest since the same in May 2001 and was last lower in March 1995.
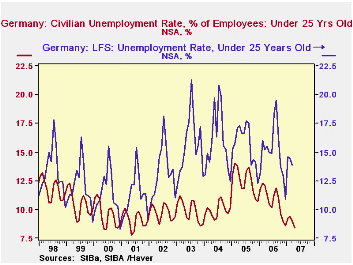
By the "registered" measure, the Germans appear distinctive in keeping unemployment down among their youth. The rate, shown in the third graph, for people under 25, was only 8.4% (not seasonally adjusted). The "registered" status means that people are indeed registered with a local employment agency and taking action to find work, at least partially through the placement service of the employment agency. So this is not the same thing as simply "wanting" to work, the concept used in the ILO definition of unemployment. Even so, it is still impressive that young people who look for work according to the registration procedures in Germany do seem to find jobs, keeping their unemployment down. The ILO "labor force" definition, by contrast, does remain considerably higher, at 13.9% in March, not seasonally adjusted, than overall unemployment, 7.2%. There is some good news, though, in recent historical comparison: March 2006 saw 15.2% and March 2005, 17.1%. So the firmer German economy is helping reduce youth unemployment by either definition. 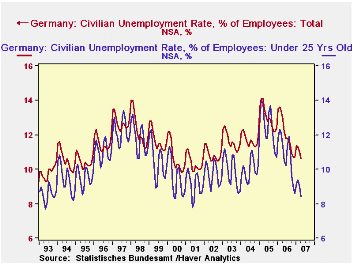
| GERMANY (Seas Adj, ex as noted) | Apr 2007 | Mar 2007 | Feb 2007 | Year Ago | 2006 | 2005 | 2004 |
|---|---|---|---|---|---|---|---|
| LFS Employment (mil) | -- | 39.50 | 39.45 | 38.89 | 39.09 | 38.82 | 38.88 |
| Change (thous) | -- | 52 | 46 | 601 | 271 | -52 | 151 |
| Yr/Yr % Change, NSA | -- | 1.6 | 1.5 | -- | 0.7 | -0.1 | 0.4 |
| Unemployment Rate (%, ILO Def.) | -- | 6.8 | 6.9 | 8.3 | 8.1 | 9.1 | 9.2 |
| Registered Unemployment Rate (%) | 9.2 | 9.2 | 9.3 | 11.3 | 10.8 | 11.7 | 10.6 |
| Job Vacancies (thous) | 610 | 621 | 642 | 503 | 564.2 | 413.1 | 284.3 |

Robert Brusca
AuthorMore in Author Profile »Robert A. Brusca is Chief Economist of Fact and Opinion Economics, a consulting firm he founded in Manhattan. He has been an economist on Wall Street for over 25 years. He has visited central banking and large institutional clients in over 30 countries in his career as an economist. Mr. Brusca was a Divisional Research Chief at the Federal Reserve Bank of NY (Chief of the International Financial markets Division), a Fed Watcher at Irving Trust and Chief Economist at Nikko Securities International. He is widely quoted and appears in various media. Mr. Brusca holds an MA and Ph.D. in economics from Michigan State University and a BA in Economics from the University of Michigan. His research pursues his strong interests in non aligned policy economics as well as international economics. FAO Economics’ research targets investors to assist them in making better investment decisions in stocks, bonds and in a variety of international assets. The company does not manage money and has no conflicts in giving economic advice.
More Economy in Brief


