 Global| Apr 30 2007
US Consumer Spending Flounders in March but Trend Still Mostly Firm
Summary
The trend to spend took a hit in March but the quarter was still strong for the consumer, as we already say in the GDP report. Three-month trends show us that spending is cooling to a 2.2% pace led by a slowdown in nondurable goods [...]
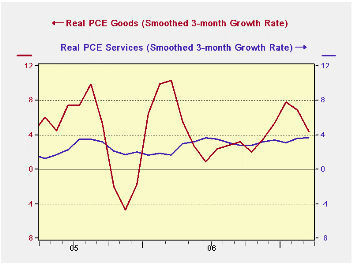
The trend to spend took a hit in March but the quarter was still strong for the consumer, as we already say in the GDP report. Three-month trends show us that spending is cooling to a 2.2% pace led by a slowdown in nondurable goods where spending dropped to a -0.6% rate of growth. Spending on durable goods still rose a robust 3.5%. Services spending continued its mild acceleration with a three-month rate of growth of 3.3%. Consumer real disposable personal income backed off in the month to a pace of 2.6% (SAAR) compared to a year/year pace of 4.1% and a three- month growth rate that is still at 3.8%.
On balance, these trends are still good and we know that monthly income and spending are subject to some volatility. So monthly declines should be taken in that spirit.
The savings rate continues negative but the rate of decline in the saving rate has switched and although the rate itself is still negative, the savings rate is headed back toward zero and perhaps into positive territory. This trend may reflect less equity extraction on the part of consumers whose houses are losing value but there is no evidence that it is affecting the pace of spending.
If we adjusted the various income components for inflation, we see steady acceleration in all these groups except for nonfarm proprietors. Real income generation trends are on solid footing and that should underpin spending as we move ahead. This trend is more important to consumer spending trends that home values.
Spending trends for goods and service are still solid. Goods spending is decelerating after a very strong increase and while services spending has been more modest it is still mildly accelerating.
With the flat core PCE deflator this month, inflation is starting to return to the Fed’s comfort zone.
| Percentage Changes At Annualized Rates: Various Horizons | |||||
| Inflation-adjusted | 1-Mo | 3-Mos | 6-Mos | 1 Year | Q1/Q4 |
| Consumption | -2.3% | 2.2% | 3.7% | 3.1% | 3.1% |
| Goods | -0.5% | 0.8% | 4.5% | 3.3% | 1.7% |
| Durable Goods | 1.4% | 3.5% | 5.5% | 4.0% | 3.2% |
| Nondurable Goods | -1.4% | -0.6% | 4.0% | 3.0% | 1.0% |
| Services | -3.4% | 3.3% | 3.2% | 3.0% | 4.1% |
| Consumer Income | |||||
| Real DPI | 2.6% | 4.6% | 4.1% | 2.9% | 4.1% |
| Per Capita | 1.8% | 3.8% | 3.2% | 1.9% | -- |
| Memo: | Mar 2007 | 3-Mos | 6-Mos | 1 Year | -- |
| Savings Rate (Pct) | -0.8 | -1.0 | -1.1 | -1.3 | -- |
| Annual Rates Of Growth | |||
| 3-mos | 6-mos | 12-mos | |
| Personal Income | 7.7% | 5.4% | 3.5% |
| Wages and Salaries | 7.2% | 5.9% | 2.4% |
| Proprietors' Income | 0.5% | 4.1% | 3.1% |
| Non Farm (prop) | -3.4% | 0.2% | 1.5% |
| Rental Income | 28.4% | 21.8% | 9.3% |
| Dividend Income | 11.4% | 10.2% | 11.0% |
| Interest Income | 11.5% | 11.9% | 1.2% |
| Transfer payments | 7.9% | 11.5% | 7.2% |
| Social Insurance Payments | 4.6% | 10.1% | 7.3% |
| Total Non-farm Income | 6.1% | 7.7% | 5.4% |
by Robert Brusca April 30, 2007

The Chicago Fed regional activity index fell sharply from 61.7 to 52.9 in April. At 52.9 the index is below its median value of 54.7 since 1968. Orders are low by comparison with their historic median. Production is, however, quite solid, off modestly month to month and residing above its period median of 59. Employment improved month to month while backlogs slid and went below the breakeven value of 50 down to 48.4.
Why do we care? The main reason we care what the Chicago region prints is that it cycles closely with changes in the national ISM index. As we saw last month, not all Chicago readings are embraced nationally and, as you would expect, extreme regional movements are not harbingers of similar strength nationally. But the general trends of the Chicago index also sketch the trends of the national ISM-MFG. And what is important here is that the Chicago index is in an upswing phase. We do expect that to remain the case with national trends when the national index is released.
Even so, some odd things are afoot, not just nationally, with regionally erratic MFG readings, but also within some of these PMI surveys. To see Chicago’s strange reading this month we refer to the chart on the right.
It depicts a usually strong positive relationship between prices paid and supplier delivery lags. Slower delivery lags are a sign of capacity constraints beginning to bind and in such cases price pressures usually mount. When MFG is slack and delivery lags are shorter (weaker supplier index) prices tend to become slack as well. But what we see this month is a huge divergence that is getting worse. Prices paid are under further upward pressure. Meanwhile supplier delivery lags have sunk to diffusion reading of 43.4 which is in the bottom third of that variable’s historic range and in the bottom 17th percentile of its full range of values since 1990.
Supplier deliveries tell us that there is plenty of slack and that deliveries are speeding up. Still we are seeing price pressures. Even the surge in the Chicago PMI last month did not do much to take up slack. Of course production is only above its own median historic reading for two months in row after being below it for five months running. So maybe this is just temporary. But it is a large divergence.
Summing Up. As expected, the Chicago PMI slowed down in April. But going back to the mid-1980s (you can also see this on the chart but its hard to gauge the magnitude) the Chicago PMI has averaged a stronger value than the ISM by about 3 points per month. That correlation would put the ISM just below 50 for April if it holds in the strict month-to-month sense. We don’t expect this. Since Chicago is coming off such a strong month a somewhat soured m/m comparison is not surprising. We do not take the Chicago PMI at face value for April. In March it was so strong, we do not even like moving averages for now. We think that the spike in March was an anomaly but we do think it was a signal and we expect the Chicago and the national ISM indexes to do better in the months ahead.
| Chicago | ||||||||
| Index | Orders | Production | Delivery | Inventories | Prices Paid | Employment | Backlogs | |
| Apr.07 | 52.9 | 56.5 | 62.2 | 43.4 | 43.2 | 64.9 | 50.5 | 48.4 |
| Mar.07 | 61.7 | 72.2 | 64.9 | 45.8 | 48.8 | 59.1 | 45.0 | 54.0 |
| Feb.07 | 47.9 | 48.7 | 51.2 | 46.5 | 54.5 | 63.2 | 50.6 | 44.3 |
| Jan.07 | 48.8 | 46.3 | 53.2 | 52.2 | 41.9 | 54.9 | 42.8 | 46.4 |
| Dec.06 | 51.6 | 56.3 | 49.7 | 45.7 | 48.9 | 56.9 | 48.2 | 44.5 |
| Nov.06 | 51.2 | 54.5 | 52.6 | 41.9 | 57.5 | 59.8 | 51.0 | 47.6 |
| Oct.06 | 53.0 | 54.5 | 53.9 | 52.9 | 66.7 | 62.3 | 55.3 | 45.9 |
| Sep.06 | 59.5 | 63.1 | 67.5 | 56.4 | 58.9 | 69.1 | 51.6 | 48.3 |
| Aug.06 | 58.4 | 62.0 | 59.4 | 59.4 | 51.4 | 75.9 | 54.9 | 46.6 |
| Jul.06 | 57.5 | 59.6 | 62.8 | 57.1 | 49.8 | 86.1 | 50.7 | 48.9 |
| Jun.06 | 58.0 | 60.0 | 58.5 | 57.0 | 54.1 | 87.8 | 50.6 | 57.3 |
| May.06 | 58.9 | 63.6 | 63.7 | 58.4 | 52.9 | 79.5 | 51.7 | 53.5 |
| Apr.06 | 58.4 | 61.0 | 69.4 | 52.5 | 54.0 | 77.4 | 49.0 | 45.6 |
| Mar.06 | 60.4 | 62.7 | 66.4 | 62.9 | 56.0 | 72.4 | 52.8 | 51.9 |
| Feb.06 | 56.6 | 57.6 | 61.2 | 59.8 | 56.3 | 74.3 | 53.2 | 51.6 |
by Robert Brusca April 30, 2007
Real construction spending was up by 0.2% in March. Nominal construction spending was revised from a weak 0.3% in February to 1.5% gain. As a result construction trends are looking a lot better. Even the drain to GDP from residential construction in 2007-Q1 is showing signs of diminishing.
At 47.9% of total construction spending, residential spending is nearly two-thirds of private spending. And while we know that residential construction has been weak we also know that prices in the sector have been much less weak than activity has been. This relationship signals that the weakness has some sort of uneven character to it. While residential construction is still declining and fell at an annualized pace of 11.7% in March, that is a pace of decline that is below its year/year pace of decline. Moreover, building is picking up outside of the residential sector. Private nonresidential construction, although smaller, dominated the weakness in the residential sector to boost private construction to a 2.3% annualized gain in the month.
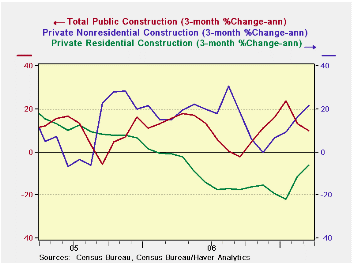
Three-month trends in spending are no longer as one-way negative. Since November, nonresidential private spending has been steadily accelerating. Its 3-month annualized rate of growth has now climbed above 20%. Meanwhile since January the 3-month growth rate of residential construction has risen from -22% to -6%. Public construction has come off during this period but is still growing at a pace of around 10%. The construction sector is getting ready to become a net CONTRIBUTOR to GDP growth despite the lingering weakness in the housing sector.
About GDP…. Residential building is only 4.4% of GDP. It can’t keep subtracting 1% from GDP growth as it did last quarter. It’s just too small. And it looks like that impact is already starting to diminish noticeably. If residential construction holds to its recent -6% growth rate it will decline by about $8 billion next quarter and that will shave just 0.3% from GDP... plus if the rest of construction remains on its trend, construction as a whole will add to GDP. The GDP story does not have the unhappy ending that some think. Not only is construction a turnaround category, but the inventory subtraction may be near the end of its retrenchment as well. But that is another report and discussion for another day.
| Percentage Change as Noted | ||||||
| 1-Mo | 1-Mo SAAR | 3-Mo | 6-Mo | Yr/Yr | Share | |
| Total | 0.2% | 2.9% | 4.8% | -0.5% | -2.0% | 100.0% |
| Private | 0.2% | 2.3% | 3.2% | -4.3% | -5.1% | 75.8% |
| Residential | -1.0% | -11.7% | -6.0% | -13.0% | -14.4% | 47.9% |
| Lodging | 13.2% | 344.7% | 134.5% | 68.5% | 58.5% | 2.3% |
| Office | 0.5% | 6.7% | 16.6% | 18.5% | 31.4% | 4.4% |
| Commercial | 1.3% | 16.8% | 16.7% | 5.5% | 10.6% | 6.9% |
| Transport | 1.4% | 18.8% | 73.4% | 74.4% | 1.3% | 0.8% |
| Communication | 2.1% | 28.1% | 65.7% | 26.5% | 20.5% | 1.6% |
| Power | 3.5% | 50.3% | -15.9% | -4.6% | 4.9% | 2.8% |
| MFG | 1.9% | 25.2% | 44.6% | 15.9% | 17.4% | 3.5% |
| Other | 1.1% | 14.7% | 1.0% | 6.3% | 9.5% | 5.8% |
| Public | 0.4% | 4.9% | 10.0% | 12.9% | 9.0% | 24.2% |
| Highway | 0.9% | 11.2% | 48.7% | 14.2% | 10.5% | 6.8% |
| Sewer | -5.8% | -51.2% | -25.1% | -6.9% | 0.8% | 1.6% |
| Water | -3.4% | -33.8% | 2.0% | 2.0% | -0.1% | 1.1% |
| Other | 1.2% | 15.2% | 1.3% | 15.7% | 10.1% | 14.8% |
by Louise Curley April 30, 2007
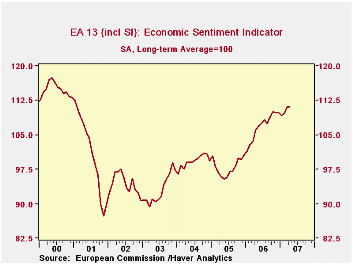
Economic sentiment in the Euro Area is still at its highest level since January, 2001, in spite of a slight decline--one basis point from March to 111.0 in April-- The economic sentiment indicator is so constructed that its long term average is 100. Values above (below) 100 indicate a level of sentiment above (below) average.
The economic sentiment indicator declined sharply in 2001, reaching a low of 87.3 in November. There were short periods when the indicator rose above 100 in 2004 and 2005, but it has only been since December 2005 that there has been a sustained upward trend as can be seen in the first chart.
Sentiment has varied among the countries. The second chart shows the path of sentiment in Germany, France and Italy since 2000. Sentiment in Germany fell the most in the early period, but now appears to be making the strongest comeback of the "Big three".In Belgium, Finland, the Netherlands and Slovakia, economic sentiment is stronger than in the "Big three" as can be seen in the third chart. Two countries where the economic sentiment indicator has fallen below 100 are Spain and Ireland, shown in the fourth chart. These same countries had, until recently been among the brighter spots in the Euro Area. 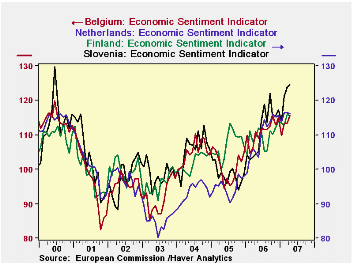

| EUROSTAT Business Climate (Long term Average=100) |
Apr 07 | Mar 07 | Apr 06 | M/M Dif | Y/Y Dif | 2006 | 2005 | 2004 |
|---|---|---|---|---|---|---|---|---|
| Euro Area | 111.0 | 111.1 | 106.0 | -0.1 | 5.0 | 106.9 | 97.9 | 99.2 |
| Germany | 111.4 | 110.0 | 105.7 | 1.4 | 5.7 | 105.9 | 95.1 | 95.8 |
| France | 109.4 | 109.3 | 106.2 | 0.1 | 3.2 | 106.9 | 103.3 | 106.0 |
| Italy | 110.4 | 111.5 | 108.4 | -1.1 | 2.0 | 108.6 | 97.9 | 98.4 |
| Belgium | 115.7 | 113.5 | 111.0 | 2.2 | 4.7 | 111.0 | 100.7 | 104.9 |
| Finland | 115.5 | 116.1 | 109.3 | -0.6 | 6.2 | 109.5 | 107.1 | 102.0 |
| Netherlands | 116.2 | 116.5 | 104.8 | -0.3 | 11.4 | 109.6 | 94.9 | 93.6 |
| Slovakia | 124.5 | 123.9 | 104.3 | 0.6 | 20.2 | 111.4 | 98.5 | 105.9 |
| Ireland | 99.2 | 101.2 | 101.0 | -2.1 | -1.8 | 103.8 | 96.9 | 96.4 |
| Spain | 98.6 | 100.8 | 98.1 | -2.2 | 0.5 | 98.5 | 100.1 | 100.6 |

Robert Brusca
AuthorMore in Author Profile »Robert A. Brusca is Chief Economist of Fact and Opinion Economics, a consulting firm he founded in Manhattan. He has been an economist on Wall Street for over 25 years. He has visited central banking and large institutional clients in over 30 countries in his career as an economist. Mr. Brusca was a Divisional Research Chief at the Federal Reserve Bank of NY (Chief of the International Financial markets Division), a Fed Watcher at Irving Trust and Chief Economist at Nikko Securities International. He is widely quoted and appears in various media. Mr. Brusca holds an MA and Ph.D. in economics from Michigan State University and a BA in Economics from the University of Michigan. His research pursues his strong interests in non aligned policy economics as well as international economics. FAO Economics’ research targets investors to assist them in making better investment decisions in stocks, bonds and in a variety of international assets. The company does not manage money and has no conflicts in giving economic advice.
More Economy in Brief


