 Global| Sep 13 2010
US And OECD LEIs Dive...Still, No Harbingers Of Growth To Come Early In The Biz Cycle
Summary
Over six months the OECD and the US trend-adjusted LEIs are now much weaker. The OECD prefers to use its measures as gauges over six month periods. On that basis either growth is slowing or an actual slow down is setting in depending [...]
 Over six months the OECD and the US trend-adjusted LEIs are now much weaker. The OECD prefers to use its measures as
gauges over six month periods. On that basis either growth is slowing or an actual slow down is setting in depending on
the region. Data for Europe and the Euro-Area currently are not available. The US indicator has slowed down but is still
growing on a six month time frame.
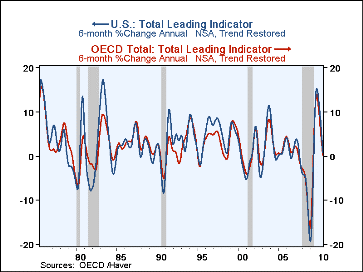
We plot these LEIs in the chart to show the history of these statistics over past business cycles. Recession busts, recovery booms and a return to flatness is not all that uncommon. So before we begin to lament the slowing of the LEIs let’s not make a pre-mature assessment of what this drop implies by taking it out of its cyclical context. So far, what we see is simply normal
In the 1982 recovery we had a very similar bust-boom and swoon, yet that recovery was a very strong one. What will determine the path of growth in the period ahead is what happens to the LEIs next. The return to a zero or even to a negative position after extreme cyclical swings is not necessarily a defining event.
In the weak 1990 recession’s cycle the up and down swings were smaller and the post recession swoon kept the US LEI above zero yet the recovery was weak one. In the 2001 business cycle the cyclical swings again were damped and the early recovery saw the LEI turn negative again, nearly as deeply as in recession itself, and recovery still persevered.
We are still waiting to see what kind of a post recession path will lie ahead. The first year’s recovery in the LEI has been spectacular (after a very deep recession drop, of course). But none of these events are much in the way of being harbingers for growth in the period ahead.
| OECD Trend-Restored Leading Indicators | ||||||
|---|---|---|---|---|---|---|
| Growth:M/M | Growth progression-SAAR | |||||
| Jul-10 | Jun-10 | 3Mos | 6Mos | 12mos | Yr-Ago | |
| OECD | -0.3% | -0.2% | -2.2% | 0.2% | 5.3% | -4.4% |
| OECD7 | -22.8% | -0.3% | -3.6% | -0.6% | 5.1% | -5.9% |
| OECD.Japan | -0.3% | -0.3% | -3.1% | -0.3% | 5.6% | -9.9% |
| OECD US | -0.4% | -0.3% | -3.1% | 0.7% | 6.5% | -6.8% |
| Six months | Six month readings at 6-Mo Intervals: | |||||
| Change in 6Mo avg | Recent six | 6Mo Ago | 12Mo Ago | 18Mo Ago | ||
| OECD | 2.2% | 3.0% | 0.2% | 10.5% | 8.6% | -15.8% |
| OECD7 | 2.1% | 3.1% | -0.6% | 11.2% | 7.9% | -17.9% |
| OECD.Japan | 2.6% | 3.5% | -0.3% | 11.8% | 0.9% | -19.6% |
| OECD US | 3.0% | 4.0% | 0.7% | 12.7% | 7.7% | -19.3% |
| Slowdowns indicated by BOLD RED | ||||||
Robert Brusca
AuthorMore in Author Profile »Robert A. Brusca is Chief Economist of Fact and Opinion Economics, a consulting firm he founded in Manhattan. He has been an economist on Wall Street for over 25 years. He has visited central banking and large institutional clients in over 30 countries in his career as an economist. Mr. Brusca was a Divisional Research Chief at the Federal Reserve Bank of NY (Chief of the International Financial markets Division), a Fed Watcher at Irving Trust and Chief Economist at Nikko Securities International. He is widely quoted and appears in various media. Mr. Brusca holds an MA and Ph.D. in economics from Michigan State University and a BA in Economics from the University of Michigan. His research pursues his strong interests in non aligned policy economics as well as international economics. FAO Economics’ research targets investors to assist them in making better investment decisions in stocks, bonds and in a variety of international assets. The company does not manage money and has no conflicts in giving economic advice.


