 Global| Jan 27 2006
US 4Q GDP Weak Due To Lower Autos & Lower Defense
by:Tom Moeller
|in:Economy in Brief
Summary
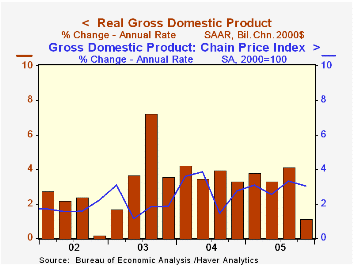
US real GDP growth last quarter weakened to the slowest in over four years. Even when the 1.1% advance is combined with 3Q, the 2.6% average gain was the weakest since early 2003 and fell short of Consensus expectations for a 2.8% [...]
Domestic demand growth suffered due to a collapse in the demand for autos. Sales incentives had pumped up 3Q vehicle & parts demand by 12.6% (AR) but the 44.9% decline last quarter pulled the demand level to its lowest since 2001. As a result, real PCE grew just 1.1% (3.0% y/y) during 4Q05.
Outside of autos, real consumer demand was firm last quarter as suggested by a 12.5% (10.6% y/y) advance in furniture & household appliances, a 10.8% (6.6% y/y) rise in apparel and a 3.2% (2.9% y/y) increase in services spending.
Business fixed investment also eased due to a shortfall in spending on transportation equipment, off 17.6% (+1.5% y/y). Investment in industrial equipment rose 10.6% (5.6% y/y) and spending on information processing equipment & software rose 9.1% (13.7% y/y).
Lower defense spending, which reversed all of the 3Q gain with a 13.1% (+0.5% y/y) decline, lowered government spending by 2.4% (+1.2% y/y). The decline in defense subtracted 0.7% percentage points from 4Q GDP growth.
Growth in residential investment eased to 3.5% (7.7% y/y), the slowest quarterly advance in a year.
The drag on GDP growth from a wider foreign trade deficit ballooned to 1.2 percentage points as imports grew 9.1% (4.6% y/y), the fastest rate of growth in a year. Exports rose 2.4% (5.7% y/y), steady with the 3Q rate of growth.Countering the drag from foreign trade, inventories contributed a large 1.5 percentage points to GDP growth, the most since early 2002.
The chain price index grew 3.0% versus a Consensus expectation for a 2.5% rise. The upside surprise during 4Q was due to a 4.9% (3.5% y/y) increase in the price index for private fixed investment which raised the price index for domestic final sales by 3.4% (3.5% y/y).
Global Economic Expansion Rolls On Into 2006 from the Federal Reserve Bank of Atlanta can be found here.
| Chained 2000$, % AR | 4Q '05 (Advance) | 3Q '05 | Y/Y | 2005 | 2004 | 2003 |
|---|---|---|---|---|---|---|
| GDP | 1.1% | 4.1% | 3.1% | 3.5% | 4.2% | 2.7% |
| Inventory Effect | 1.5% | -0.4% | -0.2% | -0.3% | 0.3% | 0.0% |
| Final Sales | -0.3% | 4.6% | 3.3% | 3.8% | 3.9% | 2.7% |
| Foreign Trade Effect | -1.2% | -0.1% | 0.0% | -0.1% | -0.5% | -0.3% |
| Domestic Final Demand | 0.8% | 4.5% | 3.3% | 3.9% | 4.4% | 3.0% |
| Chained GDP Price Index | 3.0% | 3.3% | 3.0% | 2.8% | 2.6% | 2.0% |

Tom Moeller
AuthorMore in Author Profile »Prior to joining Haver Analytics in 2000, Mr. Moeller worked as the Economist at Chancellor Capital Management from 1985 to 1999. There, he developed comprehensive economic forecasts and interpreted economic data for equity and fixed income portfolio managers. Also at Chancellor, Mr. Moeller worked as an equity analyst and was responsible for researching and rating companies in the economically sensitive automobile and housing industries for investment in Chancellor’s equity portfolio. Prior to joining Chancellor, Mr. Moeller was an Economist at Citibank from 1979 to 1984. He also analyzed pricing behavior in the metals industry for the Council on Wage and Price Stability in Washington, D.C. In 1999, Mr. Moeller received the award for most accurate forecast from the Forecasters' Club of New York. From 1990 to 1992 he was President of the New York Association for Business Economists. Mr. Moeller earned an M.B.A. in Finance from Fordham University, where he graduated in 1987. He holds a Bachelor of Arts in Economics from George Washington University.
More Economy in Brief


