 Global| Nov 29 2006
US 3Q GDP Growth Revised Up, Profits Firm
by:Tom Moeller
|in:Economy in Brief
Summary
U.S. real GDP growth for 3Q '06 was revised up to 2.2% (AR) from the advance estimate of just 1.6% growth. The revision exceeded Consensus estimates for a 1.8% increase. However, the rise in GDP last quarter still was the second [...]
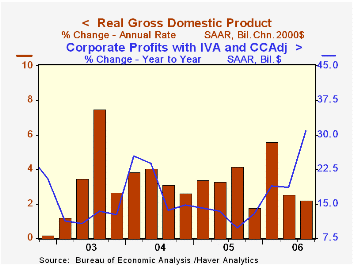
Despite slower growth in activity, corporate profitability rose a firm 4.2% (30.9% y/y) last quarter. (The comparison versus last year is exaggerated by the losses suffered due to Hurricane Katrina.) Nonfinancial corporate profits increased 8.2% (25.8% y/y) last quarter, a solid rebound from the 3.6% decline during 2Q. To the downside, however, were profits earned by US financial corporations which fell 0.5% (+62.7% y/y) and by foreign entities which fell 1.2% (+6.1% y/y).
The upward revision to GDP growth mostly reflected reduced deterioration in the net export deficit to a 0.2 percentage point subtraction. Export growth was little changed at 6.3% (9.0% y/y) but the gain in imports was reduced to 5.3% (7.2% y/y).
Inventory accumulation also added 0.2 percentage points to GDP rather than subtracting slightly, as initially estimated.Residential investment was notably weak last quarter and fell a little revised 18.0% (AR, -7.9% y/y). It was the fourth consecutive decline, the largest since 1991 and sapped 1.2 percentage points from GDP growth last quarter. That subtraction was the largest by housing since 1981.
Growth in personal consumption was reduced slightly to 2.9% (2.7% y/y) but nonresidential fixed investment growth was increased to 10.0% (8.3% y/y). That was enough to leave the growth in final sales to domestic purchasers about unchanged at 2.1%.
Government expenditures were raised slightly to 2.2% (1.7% y/y) growth though the Federal government's spending on defense fell a deepened 1.1% (-1.2% y/y), the third decline in the last four quarters.
The GDP chain price index was unchanged at 1.8%, its weakest quarterly advance in over three years. The PCE chain price index grew 2.4% (2.8% y/y) which was slightly less than estimated earlier. Less food & energy the PCE chain price index grew 2.2% (2.4% y/y), a slowdown from a 2.7% rise during 2Q. The price index for residential investment fell 0.3% (+3.2% y/y), the first decline since early 2002.
Historic Imbalances and Great Debates: Do The Economists See It Coming? from the Federal Reserve Bank of Boston is available here.
| Chained 2000$, % AR | 3Q '06 (Prelim.) | 3Q '06 (Advance) | 2Q '06 | Y/Y | 2005 | 2004 | 2003 |
|---|---|---|---|---|---|---|---|
| GDP | 2.2% | 1.6% | 2.6% | 3.0% | 3.2% | 3.9% | 2.5% |
| Inventory Effect | 0.2% | -0.1% | 0.4% | 0.6% | -0.3% | 0.4% | 0.0% |
| Final Sales | 2.1% | 1.7% | 2.1% | 2.4% | 3.5% | 3.5% | 2.5% |
| Foreign Trade Effect | -0.2% | -0.6% | 0.4% | 0.0% | -0.1% | -0.5% | -0.3% |
| Domestic Final Demand | 2.1% | 2.2% | 1.6% | 2.4% | 3.6% | 4.0% | 2.8% |
| Chained GDP Price Index | 1.8% | 1.8% | 3.3% | 2.9% | 3.0% | 2.8% | 2.1% |

Tom Moeller
AuthorMore in Author Profile »Prior to joining Haver Analytics in 2000, Mr. Moeller worked as the Economist at Chancellor Capital Management from 1985 to 1999. There, he developed comprehensive economic forecasts and interpreted economic data for equity and fixed income portfolio managers. Also at Chancellor, Mr. Moeller worked as an equity analyst and was responsible for researching and rating companies in the economically sensitive automobile and housing industries for investment in Chancellor’s equity portfolio. Prior to joining Chancellor, Mr. Moeller was an Economist at Citibank from 1979 to 1984. He also analyzed pricing behavior in the metals industry for the Council on Wage and Price Stability in Washington, D.C. In 1999, Mr. Moeller received the award for most accurate forecast from the Forecasters' Club of New York. From 1990 to 1992 he was President of the New York Association for Business Economists. Mr. Moeller earned an M.B.A. in Finance from Fordham University, where he graduated in 1987. He holds a Bachelor of Arts in Economics from George Washington University.
More Economy in Brief


