 Global| Mar 11 2009
UK Trade Picture Show More Deterioration
Summary
In the UK both export and import flows are losing momentum fast. Weak exports tell a tale of weakening growth in UK export markets. Dropping imports tell of still weakening domestic demand. Both series are quite weak and have a record [...]
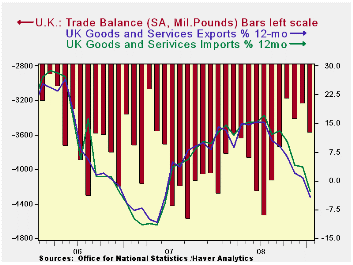
In the UK both export and import flows are losing momentum fast. Weak exports tell a tale of weakening growth in UK export markets. Dropping imports tell of still weakening domestic demand. Both series are quite weak and have a record of tracking one another relatively closely. The deficit in goods and services trade widened this month but the trends still seems to show a contraction phase is in train (see chart). While exports fell more steeply than imports in January, the two months of January and December taken together show much more similar behavior.
The trade gap is currently 41% of exports which is not far from its peak ratio of nearly 45% (since 1990). The deficit is also 29% of imports which is close to its max ratio of 31%. So while the deficit has been gradually on the decline the size of the deficit relative to the trade flows is expanding, effectively increasing its burden.
Year-over-year UK export and import values are lower by about 7% and 6% respectively. But over the recent periods we get a better taste of what is really in train. The annualized rate drop for exports is 38% over three months compared to 28% for imports. Over six months it’s 31% for exports compared to 25% for imports. Obviously the unraveling has been recent and has some on with great vigor. Sterling has dropped during this period, something that should help the UK to hold its trade competitiveness. However, that makes things more difficult for exporters based in the euro-Zone, trying to penetrate the UK market and it has been the source of some UK e-Zone tensions.
| m/m% | % Saar | ||||
| Jan-09 | Dec-08 | 3M | 6M | 12M | |
| Balance* | -££ 7.75 | -££ 7.23 | -££ 7.61 | -££ 7.66 | -££ 7.72 |
| Exports | |||||
| All Exp | -4.0% | -1.8% | -37.8% | -31.0% | -6.7% |
| Capital gds | -6.7% | 0.5% | -24.7% | -13.0% | -5.5% |
| Road Vehicles | -6.0% | -12.2% | -68.0% | -58.9% | -34.5% |
| Basic Materials | -14.6% | 7.9% | -79.6% | -75.2% | -23.4% |
| Food Feed Bev & Tbco | -0.3% | 7.3% | 13.5% | 5.4% | 8.2% |
| IMPORTS | |||||
| All IMP | -1.0% | -3.5% | -27.9% | -25.5% | -5.7% |
| Capital gds | -4.8% | -4.8% | -20.1% | -13.9% | -8.8% |
| Road Vehicles | -0.3% | -11.9% | -70.3% | -57.1% | -43.9% |
| Basic Materials | -15.2% | -4.5% | -61.8% | -53.4% | -30.2% |
| Food Feed Bev & Tbco | 3.2% | -4.1% | 14.4% | 5.3% | 10.9% |
| *Stg Blns; mo or period average | |||||

Robert Brusca
AuthorMore in Author Profile »Robert A. Brusca is Chief Economist of Fact and Opinion Economics, a consulting firm he founded in Manhattan. He has been an economist on Wall Street for over 25 years. He has visited central banking and large institutional clients in over 30 countries in his career as an economist. Mr. Brusca was a Divisional Research Chief at the Federal Reserve Bank of NY (Chief of the International Financial markets Division), a Fed Watcher at Irving Trust and Chief Economist at Nikko Securities International. He is widely quoted and appears in various media. Mr. Brusca holds an MA and Ph.D. in economics from Michigan State University and a BA in Economics from the University of Michigan. His research pursues his strong interests in non aligned policy economics as well as international economics. FAO Economics’ research targets investors to assist them in making better investment decisions in stocks, bonds and in a variety of international assets. The company does not manage money and has no conflicts in giving economic advice.
More Economy in Brief


