 Global| Jun 09 2006
UK Trade Deficit Stabilizes in April; Fuel Turns a Slight Surplus
Summary
We talked about UK trade just a month ago, but it seems worth revisiting right away. The trade deficit (on goods and services) in April held at March's level, £4.0 billion (a slight revision from the initial £3.8 billion). Both [...]
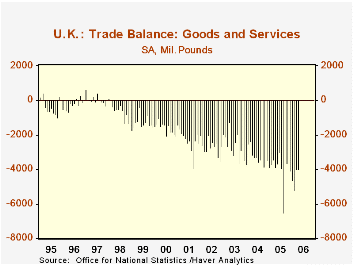
We talked about UK trade just a month ago, but it seems worth revisiting right away. The trade deficit (on goods and services) in April held at March's level, £4.0 billion (a slight revision from the initial £3.8 billion). Both exports and imports eased, imports for a second month. At £33.8 billion, imports are 2.5% below their February peak. Exports edged down 0.4% in April after a 1.7% increase in March. Even so, both exports and imports remain substantially above comparable 2005 amounts. 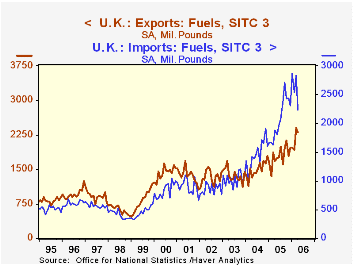
Two-way trade in fuel remains an important contributor to total UK trade flows even though fuel is only around 8% of both total exports and imports. But exports of crude oil fell 17.6% in April after a 48.3% jump in March. Volume dropped while prices continued rising. The value per tonne increased 6% in April alone. Notably, other exports, excluding fuels, held steady with March and are still more than 13% above a year ago.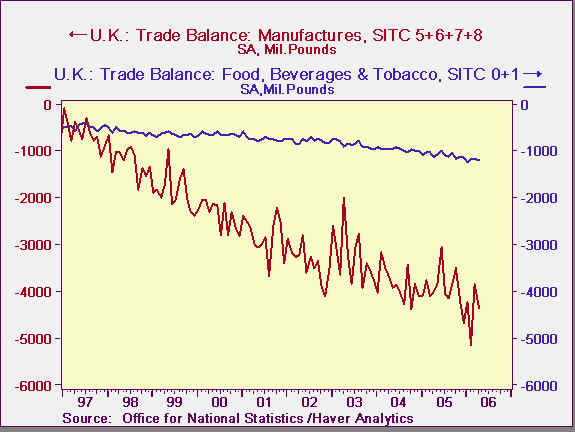
Imports of fuel had risen sharply in March and dropped even more sharply in April, maintaining a wide seesaw pattern for a fourth month. As with fuel exports, volume corrected while prices continued rising. A £0.6 billion decline in the value of fuel imports more than offset an increase in other goods and services of 1.5%.
Among non-fuel products, manufactures are sustaining a trade deficit of about £4.4 billion, although there is some tendency toward an improving turn as exports are growing while imports have moderated in both March and April. The other major segment showing a trade deficit is food, with food imports growing steadily while exports remain flat. That generates a widening deficit that reached £1.2 billion on average for the first four months this year, 26% of the total trade deficit.
| UK Trade, SA, Bil.£ | Apr 2006 | Mar 2006 | Feb 2006 | Apr 2005 | Monthly Averages|||
|---|---|---|---|---|---|---|---|
| 2005 | 2004 | 2003 | |||||
| Trade Balance: Goods & Services | -3.98 | -4.00 | -5.22 | -3.86 | -4.05 | -3.29 | -2.64 |
| Exports | 29.90 | 30.01 | 29.52 | 26.07 | 26.41 | 24.49 | 23.50 |
| Imports | 33.88 | 34.01 | 34.75 | 29.93 | 30.46 | 27.78 | 26.14 |
| Goods | -5.75 | -5.71 | -7.18 | -5.65 | -5.61 | -5.07 | -4.05 |
| Fuels | +0.07 | -0.43 | -0.61 | -0.20 | -0.29 | 0.03 | 0.35 |
| Exports | 2.30 | 2.40 | 1.93 | 1.68 | 1.79 | 1.49 | 1.38 |
| Imports | 2.23 | 2.83 | 2.54 | 1.88 | 2.08 | 1.46 | 1.03 |
| Services | 1.77 | 1.71 | 1.96 | 1.79 | 1.56 | 1.79 | 1.41 |
Carol Stone, CBE
AuthorMore in Author Profile »Carol Stone, CBE came to Haver Analytics in 2003 following more than 35 years as a financial market economist at major Wall Street financial institutions, most especially Merrill Lynch and Nomura Securities. She had broad experience in analysis and forecasting of flow-of-funds accounts, the federal budget and Federal Reserve operations. At Nomura Securities, among other duties, she developed various indicator forecasting tools and edited a daily global publication produced in London and New York for readers in Tokyo. At Haver Analytics, Carol was a member of the Research Department, aiding database managers with research and documentation efforts, as well as posting commentary on select economic reports. In addition, she conducted Ways-of-the-World, a blog on economic issues for an Episcopal-Church-affiliated website, The Geranium Farm. During her career, Carol served as an officer of the Money Marketeers and the Downtown Economists Club. She had a PhD from NYU's Stern School of Business. She lived in Brooklyn, New York, and had a weekend home on Long Island.
More Economy in Brief


