 Global| Mar 16 2012
UK PPI Getting Back Into Trouble HICP Still in Deep Trouble
Summary
The chart offers clear snap shot of how much UK PPI inflation has oscillated up and down since the financial crisis/recession. But it mostly has been too high UK PPI inflation is running at 4.1% Yr/Yr. Core inflation is lower 3% [...]
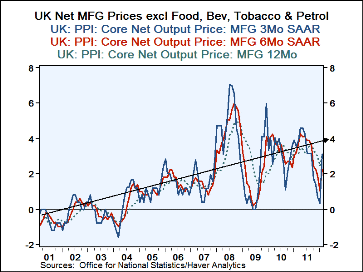 The chart offers clear snap shot of how much UK PPI inflation has oscillated up and down since the
financial crisis/recession. But it mostly has been too high
UK PPI inflation is running at 4.1% Yr/Yr. Core inflation is lower 3% Yr/Yr. Still the core is accelerating the headline is not, at least not for now. But Brent Oil prices are pushing higher at an accelerating pace.
UK PPI inflation has been anything but well behaved. The gyrations have been following closely the gyrations in oil.
What the BOE cares mot about is not the PPI but the HICP. Inflation on the HICP metric is off peak but the pace at 2.7% remains too strong relative to its alleged cap rate of 2%. November 2009 was the last time that the HICP was at the BOE sweet spot of 2% inflation. At a pace of 1.6% in October 2009 the HICP was last below 2% Yr/Yr. And now that seem to be ages ago.
Since October 2009 UK HICP price level index is 3.8 percentage points above its target top level for prices (that is, had the BOE run 2% inflation from Oct 2009 on). Over this period (27 months) the BOE has instead run an HICP inflation rate of 3.6% with core inflation up at a 2.9% pace. It has not all been all due to oil prices since the core rate is also way out of whack.
The BOE is way behind the curve and with a still struggling economy. Its fiscal austerity move has not worked and the economy is still in trouble with the BOE adrift in terms of this inflation pledge. It is not clear what the path to price stability will look like for the BOE.
| UK PPI MFG Net Output Prices | |||||||
|---|---|---|---|---|---|---|---|
| %M/M | %SAAR | ||||||
| Feb 12 |
Jan 12 |
Dec 11 |
3Mo | 6Mo | 12Mo | 12Mo Y-Ago |
|
| PPIxConst | 1.7% | -0.1% | -0.5% | 4.7% | 7.3% | 7.6% | 18.0% |
| MFG | 0.6% | 0.2% | 0.0% | 3.2% | 3.4% | 4.1% | 5.2% |
| Core | 0.8% | -0.1% | 0.1% | 3.1% | 2.2% | 3.0% | 3.1% |
| Brent | 8.1% | 2.1% | -2.3% | 35.3% | 17.4% | 15.4% | 40.6% |
Robert Brusca
AuthorMore in Author Profile »Robert A. Brusca is Chief Economist of Fact and Opinion Economics, a consulting firm he founded in Manhattan. He has been an economist on Wall Street for over 25 years. He has visited central banking and large institutional clients in over 30 countries in his career as an economist. Mr. Brusca was a Divisional Research Chief at the Federal Reserve Bank of NY (Chief of the International Financial markets Division), a Fed Watcher at Irving Trust and Chief Economist at Nikko Securities International. He is widely quoted and appears in various media. Mr. Brusca holds an MA and Ph.D. in economics from Michigan State University and a BA in Economics from the University of Michigan. His research pursues his strong interests in non aligned policy economics as well as international economics. FAO Economics’ research targets investors to assist them in making better investment decisions in stocks, bonds and in a variety of international assets. The company does not manage money and has no conflicts in giving economic advice.


