 Global| Sep 06 2007
UK IP on Extended Fading Growth Trend
Summary
UK industrial production trends are not uniform. Consumer durable and nondurable goods output has been steadily - and in the recent period - strongly expanding. That makes the UK unlike most EMU countries with its strong consumer [...]
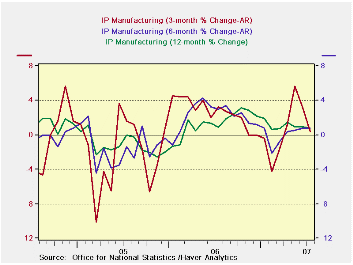
UK industrial production trends are not uniform. Consumer durable and nondurable goods output has been steadily - and in the recent period - strongly expanding. That makes the UK unlike most EMU countries with its strong consumer sector (actually France has done OK in this regard, too). Intermediate output also has been gaining momentum. Capital goods output, on the other hand, has been fading. Obviously, consumer durables is being driven by the strength in vehicles output. Textiles output is slowing. Food production has picked up after some past weakness. Mining has also seen output pick up its pace and hold it. (These comments look at 1-year to 6-month to 3-month trends across July, they do not refer to the monthly patterns which are too volatile to explain). Note that the story based on these sequential growth rates across June is quite different. But we are trying to get in touch with newer trends and to understand what is unfolding in Q3.
| Saar except m/m | M/M | Jul-07 | Jun-07 | Jul-07 | Jun-07 | Jul-07 | Jun-07 | |||
| UK MFG | Jul-07 | Jun-07 | May-07 | 3-Mo | 3-Mo | 6-mo | 6-mo | 12-mo | 12-mo | Q-3-Date |
| MFG | -0.3% | 0.1% | 0.3% | 0.4% | 3.2% | 0.8% | 0.8% | 0.8% | 1.0% | -0.8% |
| Consumer | ||||||||||
| Durables | 0.0% | 3.7% | -1.1% | 10.9% | 2.7% | 5.3% | -2.2% | 3.1% | 1.3% | 13.2% |
| Nondurables | 0.4% | -0.5% | 0.4% | 1.2% | 1.2% | -0.2% | -2.8% | -0.1% | -0.5% | 1.2% |
| Intermediate | 0.2% | 0.0% | 0.8% | 4.3% | 3.9% | 2.6% | 4.1% | 1.3% | 0.6% | 3.0% |
| Capital | -1.2% | -0.1% | 0.3% | -4.0% | 4.9% | 0.0% | 2.8% | 1.0% | 2.7% | -6.7% |
| Memo: Detail | 1-Mo% | 1-Mo% | 1-Mo% | 3-Mo | 3-Mo | 6-mo | 6-mo | 12-mo | 12-mo | Q-3-Date |
| Food Drink & Tobacco | 0.6% | -0.2% | 0.0% | 1.6% | -1.2% | -1.0% | -4.0% | -0.4% | -1.7% | 2.8% |
| Textile & Leather | 0.1% | 0.9% | -0.7% | 1.4% | 3.3% | 3.1% | 0.9% | 2.7% | 1.3% | 3.1% |
| Motor Vehicles & Trailer | 1.9% | 2.8% | 0.6% | 23.2% | 21.2% | 15.4% | 16.5% | 9.2% | 6.7% | 26.3% |
| Mining and Quarry | 1.2% | -0.8% | 1.3% | 7.0% | 7.1% | 7.4% | 11.1% | 2.8% | 0.7% | 6.7% |
| Electricity, Gas & Water | 0.2% | -0.6% | 2.3% | 7.7% | 1.7% | -0.4% | 0.0% | -0.1% | -0.8% | 3.3% |
by Tom Moeller September 6, 2007
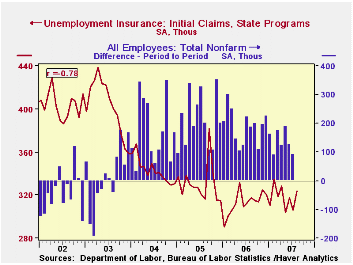
Initial claims for unemployment insurance fell sharply last week and more than reversed the prior week's large increase. Claims for the week ending 8/30 fell 19,000 to 318,000. Consensus expectations were for 328,000 claims.
The prior week's rise of 12,000 had raised fears in the market that recent gains in the labor market would slow. 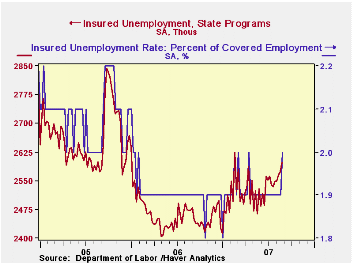
A claims level below 400,000 typically has been associated with growth in nonfarm payrolls. During the last six years there has been a (negative) 78% correlation between the level of initial claims and the m/m change in nonfarm payroll employment.
The four-week moving average of initial claims rose slightly to 325,750 (2.9% y/y), its highest level since April.
Continuing claims for unemployment insurance rose 25,000 after a downwardly revised 7,000 increase during the prior week. The continuing claims numbers lag the initial claims figures by one week.
The insured rate of unemployment increased to 2.0%.
The Fed's latest Beige Book covering regional economic activity is available here.
| Unemployment Insurance (000s) | 08/30/07 | 08/23/07 | Y/Y | 2006 | 2005 | 2004 |
|---|---|---|---|---|---|---|
| Initial Claims | 318 | 337 | 1.0% | 313 | 331 | 343 |
| Continuing Claims | -- | 2,359 | 5.3% | 2,545 | 3.3% | 2,459 |
by Tom Moeller September 6, 2007
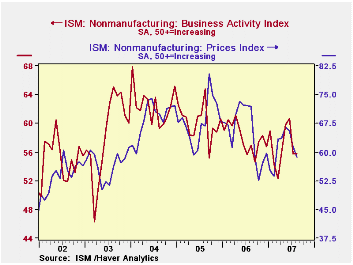
The non-manufacturing sector Business Activity Index for August was unchanged from its July level of 55.8, according to the Institute for Supply Management. Consensus expectations had been for a decline to 54.5.
Since the series' inception in 1997 there has been a 46% correlation between the level of the Business Activity Index and the Q/Q change in real GDP for services plus construction.
The employment sub index, however, fell a sizable 3.8 points to 47.9. The latest figure, if it holds, would indicate declines in employment; it followed a 3.3 point drop in July. Since the series' inception in 1997 there has been a 56% correlation between the level of the ISM non-manufacturing employment index and the m/m change in payroll employment in the service producing plus the construction industries.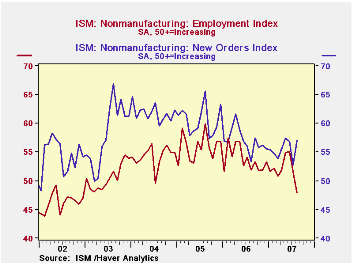
Offsetting this decline was a 4.2 point increase in the new orders index to 57.0 and the latest indicates growth in new orders.
Pricing power slipped for the third month to its lowest level since February. Since inception eight years ago, there has been a 70% correlation between the price index and the y/y change in the GDP services chain price index.
ISM surveys more than 370 purchasing managers in more than 62 industries including construction, law firms, hospitals, government and retailers. The non-manufacturing survey dates back to July 1997.The Business Activity Index for the non-manufacturing sector reflects a question separate from the subgroups mentioned above. In contrast, the NAPM manufacturing sector composite index is a weighted average of five components.
| ISM Nonmanufacturing Survey | August | July | August '06 | 2006 | 2005 | 2004 |
|---|---|---|---|---|---|---|
| Business Activity Index | 55.8 | 55.8 | 56.9 | 58.0 | 60.2 | 62.5 |
| Prices Index | 58.6 | 61.3 | 71.9 | 65.2 | 68.0 | 68.8 |
by Carol Stone September 6, 2007
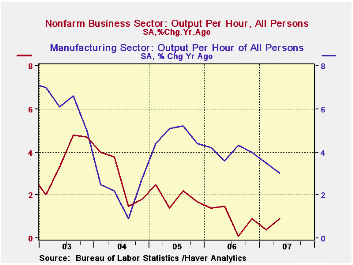
Nonfarm labor productivity was revised to 2.6% in Q2 from 1.8% reported a month ago. The revision was marginally above market forecasts, which called for 2.5%, based on the most recent revision to GDP.
Compensation per hour last quarter was a bit higher than the original 3.9% increase, and is now estimated at 4.1%.
Despite the upward move in compensation, unit labor costs are revised here to just 1.4%, compared to the originally reported 2.1% and modestly lower even than the 1.6% forecast growth.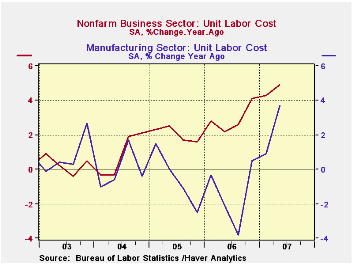
Factory sector productivity growth was also revised higher, but just slightly to 1.8% from 1.6% in the last report. Compensation in manufacturing is now seen up 3.4% in the quarter compared with 2.8% reported last month. This makes the year/year rate 6.8%, up from 6.2% in the prior report; these are both stronger than anytime since Q4 2003. Year-to-year changes in manufacturing unit labor costs were minimal from mid-2001 until Q1 this year, but in Q2, the compensation and productivity numbers yielded a 3.7% rise. Granted, the quarter-to-quarter growth was greatest in Q4 2006 and Q1 2007, but productivity in factories has been sluggish for three consecutive quarters, suggesting that unit labor costs are still subject to upward pressure presently, not relief.
| Non-farm Business Sector (SAAR) | Q2 '07 (Rev) | Q2 '07 (Old) | Q1 '07 | Y/Y | 2006 | 2005 | 2004 |
|---|---|---|---|---|---|---|---|
| Output per Hour | 2.6% | 1.8% | 0.7% | 0.9% | 1.0% | 1.9% | 2.7% |
| Compensation per Hour | 4.1% | 3.9% | 5.9% | 5.8% | 3.9% | 4.0% | 3.6% |
| Unit Labor Costs | 1.4% | 2.1% | 5.2% | 4.9% | 2.9% | 2.0% | 0.9% |
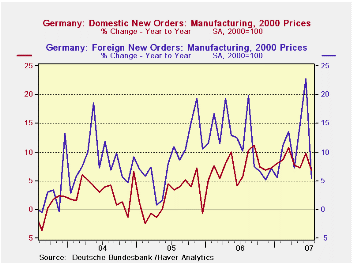 German orders surprised us with a sharp slide in the first month of the new quarter. As the chart shows the sharp monthly drop offsets a pervious surge in orders. Indeed in the third quarter to date orders are falling at a -17% annualized rate (July/Q2-annualized). That Q3 drop compares to an actual quarterly gain of 18%: both figures are compounded and annualized, as are those that follow in this section. Foreign orders are off the hardest, dropping at a 27% pace in Q3 to date compared to an actual annualized rise of 29% in Q2. Domestic orders are off at a 4.7% pace in Q3 compared to an actual rise at a 7.7% in Q2. For the most part Q3 is starting off with the surge from Q2 running off. Further declines will be needed in Q3 to keep these annualized growth rates this negative. In other words, if orders flatten where they are now, the negative annualized Q3 growth rates will increase in absolute value (diminish their downdraft). German orders surprised us with a sharp slide in the first month of the new quarter. As the chart shows the sharp monthly drop offsets a pervious surge in orders. Indeed in the third quarter to date orders are falling at a -17% annualized rate (July/Q2-annualized). That Q3 drop compares to an actual quarterly gain of 18%: both figures are compounded and annualized, as are those that follow in this section. Foreign orders are off the hardest, dropping at a 27% pace in Q3 to date compared to an actual annualized rise of 29% in Q2. Domestic orders are off at a 4.7% pace in Q3 compared to an actual rise at a 7.7% in Q2. For the most part Q3 is starting off with the surge from Q2 running off. Further declines will be needed in Q3 to keep these annualized growth rates this negative. In other words, if orders flatten where they are now, the negative annualized Q3 growth rates will increase in absolute value (diminish their downdraft). Month to month falls… Geographic detail shows us that foreign orders have fallen by the most within the Euro area. There, orders are off at 21.7 percent rate m/m after a 22.4% m/m spurt in June. Most of the unwind is in capital goods. But the drop spans categories. Foreign orders outside the Euro area also fell but by 1.9% after falling by 0.9% in June as well. The July drops were located in consumer durables and basic goods; capital goods orders continued to rise, albeit slowly. Intra Euro area trade issues. The Euro backed off after this report. But as we can see the main German weakness was in its intra-Euro area export sales. These are that odd brand of exports that have no direct exchange rate consequences. German exports to France (for example) may compete with the French-made goods but they are using the same currency! Still to the extent that the euro rises and Germans lose competitiveness because of it, the loss is not Vis-à-Vis French producers, but to other non-euro members like US exporters. So a strong euro might cost Germany some of its export market in France as US exporters benefit. It is not that there are not exchange rate consequences for these intra-Euro area exports, but that they are of a third party nature through what economists call cross price elasticities of demand. The likely facts… Germany’s order weakness in other non-euro markets are much more tempered making the drop in intra-Euro orders look less like they are due to sudden exchange rate related losses than just due to the variability of bulk orders. Still there remains the questions of trend for German orders. The question of trend… Despite the variability in orders, German orders are lower (annualized) over three months than they were over the past year or even the year before that. Is the German growth machine starting to slow and is this a problem since the consumer has not kicked in and since, with the new financial hit, the consumer might remain more cautious and even capital equipment demand could soften? That appears to be where the risk is going. These are trends to stay plugged into. We will follow them closely as European growth may depend on them. |
| Real and SA | % M/M | % SAAR | |||||
| Jul-07 | Jun-07 | May-07 | 3-Mo | 6-Mo | 12-Mo | YrAgo | |
| Total Orders | -7.1% | 5.1% | 3.0% | 2.2% | 1.1% | 6.1% | 8.0% |
| Foreign | -11.7% | 9.4% | 4.1% | 2.2% | 1.1% | 5.5% | 10.2% |
| Domestic | -1.7% | 0.4% | 2.0% | 2.5% | 1.3% | 6.8% | 5.7% |
| Sector Sales | |||||||
| MFG/Mining | 0.1% | -0.5% | 2.5% | 8.7% | 4.3% | 5.8% | 6.8% |
| Consumer Goods | -1.6% | -1.3% | 1.4% | -6.0% | -3.0% | 1.9% | 2.1% |
| Consumer Durables | -0.8% | 1.8% | 2.3% | 14.1% | 6.8% | 5.4% | 4.3% |
| Consumer Non-Durables | -1.8% | -1.9% | 1.4% | -9.1% | -4.6% | 1.3% | 1.7% |
| Capital Goods | 1.9% | -1.5% | 4.4% | 20.6% | 9.8% | 7.5% | 8.1% |
| Intermediate Goods | -1.1% | 1.1% | 1.3% | 4.7% | 2.3% | 5.9% | 8.1% |
| MFG | 0.1% | -0.4% | 2.5% | 8.8% | 4.3% | 5.6% | 6.3% |

Robert Brusca
AuthorMore in Author Profile »Robert A. Brusca is Chief Economist of Fact and Opinion Economics, a consulting firm he founded in Manhattan. He has been an economist on Wall Street for over 25 years. He has visited central banking and large institutional clients in over 30 countries in his career as an economist. Mr. Brusca was a Divisional Research Chief at the Federal Reserve Bank of NY (Chief of the International Financial markets Division), a Fed Watcher at Irving Trust and Chief Economist at Nikko Securities International. He is widely quoted and appears in various media. Mr. Brusca holds an MA and Ph.D. in economics from Michigan State University and a BA in Economics from the University of Michigan. His research pursues his strong interests in non aligned policy economics as well as international economics. FAO Economics’ research targets investors to assist them in making better investment decisions in stocks, bonds and in a variety of international assets. The company does not manage money and has no conflicts in giving economic advice.
More Economy in Brief


