 Global| Apr 08 2009
UK Industrial Output Falls Again
Summary
UK’s industrial output index fell again making it twelve straight months of decline. There is a slight let up in the pace of decline in IP as the growth rate’s declining profile at the three month tenor shows signs of abating (see [...]
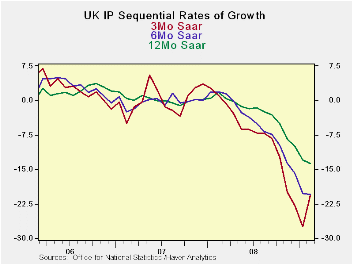
UK’s industrial output index fell again making it twelve
straight months of decline. There is a slight let up in the pace of
decline in IP as the growth rate’s declining profile at the three month
tenor shows signs of abating (see chart). Still other trends show that
strong downward momentum remains in force.
Consumer durables output accelerated its drop over
three-months compared to six months as did intermediate and capital
goods industries. Even so, each of these the three-month growth rates
for February was stronger than in January. Consumer nondurables
industrial output rose in February. Most sectors saw growth rates
worsen over three-months compared to six months. Food and drink was an
exception; motor vehicles were another exception as growth rates
hovered at a horrific -64% annual rate.
The growth rates being posted for the quarter-to-date continue
to be very weak and in line with recent trends. Q1 is cropping up to be
another bad one.
| UK IP and MFG | ||||||||||
|---|---|---|---|---|---|---|---|---|---|---|
| Saar except m/m | Mo/Mo | Feb 09 |
Jan 09 |
Feb 09 |
Jan 09 |
Feb 09 |
Jan 09 |
|||
| UK MFG | Feb 09 |
Jan 09 |
Dec 08 |
3Mo | 3Mo | 6mo | 6mo | 12mo | 12mo | Q1 Date |
| MFG | -0.9% | -3.0% | -1.9% | -20.7% | -27.4% | -20.4% | -20.2% | -13.8% | -13.0% | -24.2% |
| Consumer | ||||||||||
| C-Durables | -0.4% | -4.8% | -3.6% | -30.1% | -35.3% | -26.6% | -27.6% | -21.3% | -19.8% | -33.0% |
| C-Non-durables | -0.1% | 0.8% | -0.5% | 0.8% | -6.8% | -5.4% | -5.6% | -5.0% | -4.4% | -1.2% |
| Intermediate | -1.4% | -3.3% | -1.7% | -23.0% | -25.4% | -20.7% | -19.9% | -13.8% | -12.7% | -25.0% |
| Capital | -1.6% | -5.4% | -2.1% | -31.1% | -36.4% | -26.1% | -25.3% | -16.9% | -16.1% | -35.1% |
| Memo:Detail | 1Mo% | 1Mo% | 1Mo% | 3Mo | 3Mo | 6mo | 6mo | 12mo | 12mo | Q1 Date |
| Food Drink&tobacco | 0.2% | 1.6% | -2.1% | -1.6% | -5.9% | -3.4% | -2.4% | -3.9% | -3.8% | -0.5% |
| Textile&Leather | -0.8% | -1.5% | -2.1% | -16.6% | -6.5% | -10.8% | -11.3% | -5.4% | -4.1% | -12.3% |
| Motor Vehicles & trailer | -4.1% | -18.8% | -0.8% | -64.3% | -77.2% | -46.5% | -64.9% | -46.0% | -43.5% | -74.9% |
| Mining and Quarry | -0.9% | -2.9% | -0.3% | -15.1% | -6.8% | -8.4% | -7.8% | -7.7% | -7.8% | -13.7% |
| Electricity, gas&H2O | -2.5% | 0.1% | 0.4% | -7.9% | -3.5% | -7.6% | -5.6% | -4.9% | -2.6% | -6.4% |

Robert Brusca
AuthorMore in Author Profile »Robert A. Brusca is Chief Economist of Fact and Opinion Economics, a consulting firm he founded in Manhattan. He has been an economist on Wall Street for over 25 years. He has visited central banking and large institutional clients in over 30 countries in his career as an economist. Mr. Brusca was a Divisional Research Chief at the Federal Reserve Bank of NY (Chief of the International Financial markets Division), a Fed Watcher at Irving Trust and Chief Economist at Nikko Securities International. He is widely quoted and appears in various media. Mr. Brusca holds an MA and Ph.D. in economics from Michigan State University and a BA in Economics from the University of Michigan. His research pursues his strong interests in non aligned policy economics as well as international economics. FAO Economics’ research targets investors to assist them in making better investment decisions in stocks, bonds and in a variety of international assets. The company does not manage money and has no conflicts in giving economic advice.
More Economy in Brief


