 Global| Dec 29 2008
UK House Prices Continue to Fall, Sales Harder to Make, Equity Withdrawals Turn Negative
Summary
The results of the December Hometrack Survey of real estate agents in England and Wales regarding the prices at which houses are being sold and the ease or difficulty in making sales was released today. The year to year decline in [...]
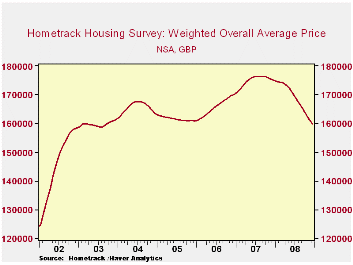
The results of the December Hometrack Survey of real estate agents in England and Wales regarding the prices at which houses are being sold and the ease or difficulty in making sales was released today. The year to year decline in house prices that started in April, 2008 has continued and intensified. In December the weighted overall average price of a house was 159,900 pounds, a price this low was last seen in July and August of 2003, as can be seen in the first chart.
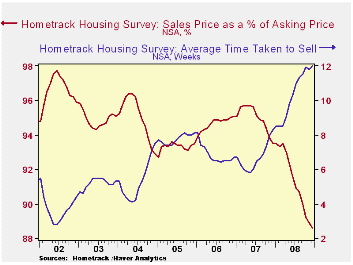 The sales price of a house in December was 88.6% of the asking
price, the lowest ratio recorded since the survey began in January
2001. Similarly the time it took to complete a sale was 12 weeks, the
longest time recorded in the survey. The ratio of selling to asking
price and the number of weeks to complete a sale are shown in the
second chart.
The sales price of a house in December was 88.6% of the asking
price, the lowest ratio recorded since the survey began in January
2001. Similarly the time it took to complete a sale was 12 weeks, the
longest time recorded in the survey. The ratio of selling to asking
price and the number of weeks to complete a sale are shown in the
second chart.
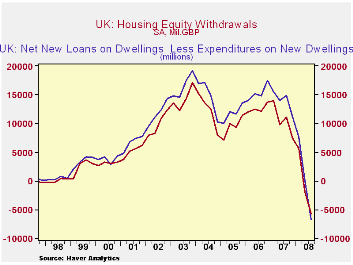
Also released today were data on equity withdrawals during the third quarter of this year. For the second quarter in a row, equity withdrawals were negative. In order to see what this means it is useful to see how the series is derived. According to the Bank of England, equity withdrawals are equal to that part of secured borrowing that is not invested in the housing market. The series is measured by the sum of household's net lending secured on dwellings and capital grants for households paid to persons and household associations less the sum of expenditures on the construction of dwellings and net transfers of land to the household sector. Data are available only for the net lending and expenditures on dwellings, but these are by far the most important factors in equity withdrawals. As can be seen in the third chart, the difference between lending and construction is a close approximation of equity withdrawals.
| UNITED KINGDOM | Dec 08 | Nov 08 | Oct 08 | Sep 08 | Aug 08 | Jul 08 | June 08 |
|---|---|---|---|---|---|---|---|
| Hometrack Housing Survey | |||||||
| House Prices (Thou GBP) | 159.9 | 161.4 | 163.2 | 165.3 | 167.0 | 168.5 | 170.5 |
| Ratio of Sale Price to Asking Price (%) | 88.6 | 88.9 | 89.2 | 90.0 | 90.7 | 90.9 | 91.6 |
| Number of Weeks to Complete Sale (Number) | |||||||
| Q3 08 | Q2 08 | Q1 08 | Q4 07 | Q3 07 | Q2 07 | Q1 07 | |
| Equity Withdrawals (Mil. GBP) | -5695 | -1951 | 5650 | 7317 | 11170 | 9846 | 13941 |
| Net Lending - Construction (Mil. GBP) | -6684 | -99 | 7581 | 11190 | 14948 | 14077 | 15553 |
| Net Lending Secured on Dwellings (Mil. GBP) | 4656 | 11628 | 20033 | 24032 | 28177 | 27352 | 28809 |
| Expenditure on Construction of Dwellings (Mil. GBP) | 11340 | 11727 | 12452 | 12542 | 13229 | 13275 | 13256 |
More Economy in Brief


