 Global| May 06 2010
U.S. Worker 1Q Productivity Growth Moderates, But Still Looks Strong Y/Y
by:Tom Moeller
|in:Economy in Brief
Summary
Growth in worker productivity in the nonfarm business sector slowed last quarter to 3.6% from 6.3% during 4Q. A near-halving of output growth did not prompt as much of a cutback in aggregate hours-worked (employment times hours [...]
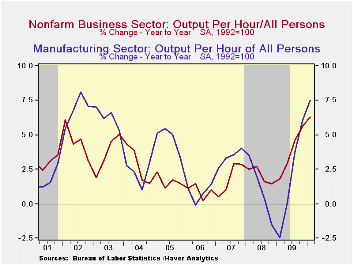
Growth in worker productivity in the nonfarm business sector slowed last quarter to 3.6% from 6.3% during 4Q. A near-halving of output growth did not prompt as much of a cutback in aggregate hours-worked (employment times hours worked). Nevertheless, the 6.3% surge in U.S. worker productivity growth during the last four quarters was the strongest since early-1962 (no typo). New technologies, improved work techniques and an improved labor skill-sets have paid off. Productivity last quarter exceeded Consensus expectations for a 2.5% rise.
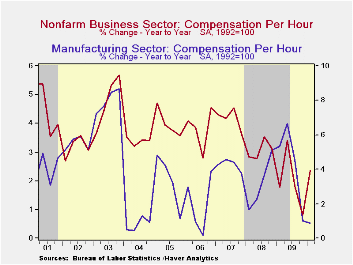
The slowdown in 1Q productivity occurred as real output growth slowed to 4.4% (3.1% y/y) from 7.0% during 4Q. That was met by a slight acceleration in hours worked to 0.8% (-3.0% y/y) from 0.7%.Growth in compensation costs also accelerated to 1.9% (2.3% y/y). Four-quarter growth in compensation was nearly the slowest since 1995.
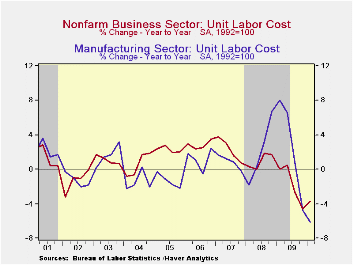
The rate of decline in unit labor costs eased during 4Q '09 as compensation picked up slightly. Regardless, the four-quarter decline in costs of 3.7% was the largest on record. That enabled corporate profits to jump by nearly one-third last year.
In the factory sector alone, worker productivity growth also slowed sharply to 2.5% (7.5% y/y) from 6.5% during 4Q '09. The slowdown occurred as output rose an accelerated 7.5% (3.3% y/y) compared to the pickup in hours-worked to 4.9% (-3.9% y/y) following a slight 4Q decline. Compensation fell 1.2% but the y/y change of 0.9% was the weakest since 2006. The combination of lower compensation and the rise in productivity dropped unit labor costs by 3.7%.
The productivity & cost figures are available in Haver's USECON database.
| Nonfarm Business Sector(SAAR,%) | 1Q '10 | 4Q '09 | 3Q '09 | 1Q Y/Y | 2009 | 2008 | 2007 |
|---|---|---|---|---|---|---|---|
| Output per Hour (Productivity) | 3.6 | 6.3 | 7.8 | 6.3 | 3.7 | 2.1 | 1.8 |
| Compensation per Hour | 1.9 | 0.4 | -0.4 | 2.3 | 1.9 | 3.1 | 4.2 |
| Unit Labor Costs | -1.6 | -5.6 | -7.6 | -3.7 | -1.7 | 1.0 | 2.3 |
| Manufacturing Sector | |||||||
| Output per Hour | 2.5 | 6.5 | 14.8 | 7.5 | 1.8 | 1.1 | 3.4 |
| Compensation per Hour | -1.2 | -0.3 | -1.0 | 0.9 | 4.4 | 3.2 | 4.3 |
| Unit Labor Costs | -3.7 | -6.4 | -13.7 | -6.1 | 2.5 | 2.1 | 0.9 |
by Robert Brusca May 06, 2010
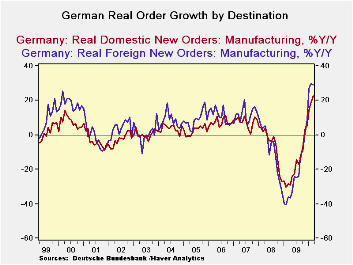
In March German orders spurted beyond expectations rising by 5% after being flat in February. Foreign orders built on a 1.7% gain in February rising by 4.7% in March. Domestic orders spurted by 5.4% coming off a 1.7% decline in February. Over three months domestic and foreign orders are growing at almost identical 48% compounded growth rates; over six month their growth is clearly identical as well. Yr/Yr foreign orders are stronger, rising by 29% compared to nearly 23% for domestic orders. German orders are strong no matter how you slice them. But not all sectors are strong.
Consumer orders remain mixed in Germany. Consumer durables goods orders did better in March by reducing the pace at which they declined to -0.7% from -2.4% in February. Consumer durable goods orders are rising over three months, however, at a compounded annual rate pace of just 3.7%, up from 1.8% over six months. Consumer nondurables orders spiked by 5.4% in March, after dropping by 2.2% in February. They are still declining at an 8.2% annual rate over three months, however.
Capital goods are the backbone of the German recovery. Those orders rose by 2.4% in March after rising by 0.5% in February. Over three months capital goods orders are rising at a 24.7% pace up from an 11.7% pace over six months and from 6.7% Yr/Yr.
Intermediate goods orders also rose in March making gains of 2.8% after edging lower by 0.3% in February. Intermediate goods orders spurted at a 21% annual rate over three months compared to rising at a 10% over three months.
Manufacturing sales also were strong in March and their sequential growth rates show persisting strength.
On balance German orders were an upside surprise. The strength remains in the industrial sector with consumer goods starting to break out of their declining ways but still not clearly shaking off the lethargy. Orders grew at a 28% annualized rate in the quarter while sales grew at a 5% pace.
The weakening euro is going to help cement these trends as long as the financial problems in Greece do not spread too much and damp growth in the e-Zone and the surrounding environs. Right now tensions are running high as Moody’s warned on potential banking sector problems as banks hold a lot of government bonds and it is some of the debt-ridden European government‘s that issued those bonds that are under ratings pressure. If debt reschedulings were to occur there could be losses pushed onto bond holders and slapped onto bank balance sheets. In its meeting today the ECB held rates steady but that was all it held steady. So far it is not willing to do nay more, much to the markets consternation. Nervousness in the European markets is clear. The potential for knock-on effects even to an economy like Germany that seems to be doing so well is a real risk.
| German Orders and Sales By Sector and Origin | ||||||||
|---|---|---|---|---|---|---|---|---|
| Real and SA | % M/M | % Saar | ||||||
| Mar-10 | Feb-10 | Jan-10 | 3-MO | 6-Mo | 12-Mo | YrAgo | QTR-2-Date | |
| Total Orders | 5.0% | 0.0% | 5.2% | 49.1% | 22.1% | 26.0% | -32.8% | 28.5% |
| Foreign | 4.7% | 1.7% | 3.8% | 48.7% | 21.9% | 29.0% | -36.2% | 28.5% |
| Domestic | 5.4% | -1.7% | 6.7% | 48.9% | 22.0% | 22.8% | -28.6% | 28.2% |
| Real Sector Sales | ||||||||
| MFG/Mining | 2.9% | -0.2% | 1.2% | 16.3% | 7.8% | 8.5% | -21.8% | 5.6% |
| Consumer | 4.6% | -2.1% | -4.0% | -6.8% | -3.5% | 2.5% | -11.3% | -6.8% |
| Cons Durables | -0.7% | -2.4% | 4.1% | 3.7% | 1.8% | 5.4% | -22.7% | 6.4% |
| Cons Non-Durable | 5.4% | -2.2% | -5.0% | -8.2% | -4.2% | 2.1% | -9.4% | -8.6% |
| Captial Gds | 2.4% | 0.5% | 2.6% | 24.7% | 11.7% | 6.7% | -24.5% | 12.9% |
| Intermediate Gds | 2.8% | -0.3% | 2.3% | 21.0% | 10.0% | 15.2% | -24.4% | 4.6% |
| All MFG-Sales | 2.7% | -0.2% | 1.2% | 15.7% | 7.6% | 8.3% | -21.7% | 5.3% |
by Tom Moeller May 6, 2010

The Bureau of Labor Statistics reported that initial claims for jobless insurance fell 7,000 to 444,000 after the prior week's lessened 8,000 drop. The latest level was near this cycle's lowest but fell slightly short of Consensus expectations for a decline to 440,000 claims. Last week's figure was down from the recession peak of 651,000 reached in March of 2009. The four-week moving average of initial claims increased to 458,500.
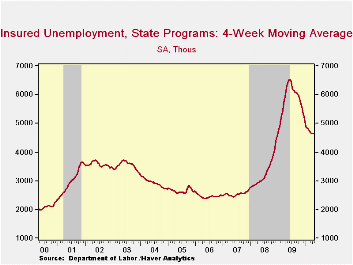
A 59,000 decline in continuing claims for unemployment insurance during the latest week followed a little-revised 10,000 drop during the prior week. They were down by one-third from the June '09 peak. The overall decline is a function of the improved job market but also reflects the exhaustion of 26 weeks of unemployment benefits. Continuing claims provide an indication of workers' ability to find employment. The four-week average of continuing claims at 4.649M remained near the cycle low. This series dates back to 1966.
Extended benefits for unemployment insurance slipped w/w to 201,487. However, they were down by three-quarters from a peak of 597,688 reached in November.
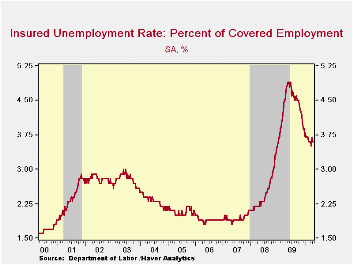
The insured unemployment rate remained at 3.6% where it has been since mid-February. The rate reached a high of 4.9% during May. During the last ten years, there has been a 96% correlation between the level of the insured unemployment rate and the overall rate of unemployment published by the Bureau of Labor Statistics.
The highest insured unemployment rates in the week ending April 17 were in Alaska (6.6 percent), Puerto Rico (6.0), Oregon (5.8), Nevada (5.1), Wisconsin (5.1), California (5.0), Michigan (4.9), Montana (4.9), Pennsylvania (4.9), Idaho (4.7), and North Carolina (4.7). The lowest insured unemployment rates were in Virginia (1.9), Texas (2.3), Georgia (2.8), Maryland (3.0), Florida (3.2), Wyoming (3.4), Ohio (3.4), New York (3.5) and Maine (3.7). These data are not seasonally adjusted but the overall insured unemployment rate is.
The unemployment insurance claims data is available in Haver's WEEKLY database and the state data is in the REGIONW database.
| Unemployment Insurance (000s) | 05/01/10 | 04/24/10 | 04/17/10 | Y/Y | 2009 | 2008 | 2007 |
|---|---|---|---|---|---|---|---|
| Initial Claims | 444 | 451 | 459 | -26.5% | 572 | 419 | 321 |
| Continuing Claims | -- | 4,594 | 4,653 | -26.2% | 5,809 | 3,340 | 2,549 |
| Insured Unemployment Rate (%) | -- | 3.6 | 3.6 | 4.9(5/2009) | 4.4 | 2.5 | 1.9 |

Tom Moeller
AuthorMore in Author Profile »Prior to joining Haver Analytics in 2000, Mr. Moeller worked as the Economist at Chancellor Capital Management from 1985 to 1999. There, he developed comprehensive economic forecasts and interpreted economic data for equity and fixed income portfolio managers. Also at Chancellor, Mr. Moeller worked as an equity analyst and was responsible for researching and rating companies in the economically sensitive automobile and housing industries for investment in Chancellor’s equity portfolio. Prior to joining Chancellor, Mr. Moeller was an Economist at Citibank from 1979 to 1984. He also analyzed pricing behavior in the metals industry for the Council on Wage and Price Stability in Washington, D.C. In 1999, Mr. Moeller received the award for most accurate forecast from the Forecasters' Club of New York. From 1990 to 1992 he was President of the New York Association for Business Economists. Mr. Moeller earned an M.B.A. in Finance from Fordham University, where he graduated in 1987. He holds a Bachelor of Arts in Economics from George Washington University.
More Economy in Brief


