 Global| Mar 11 2009
U.S. Weekly Mortgage Applications Rise
by:Tom Moeller
|in:Economy in Brief
Summary
The total number of mortgage applications recovered last week after three consecutive weeks of decline, reported the Mortgage Bankers Association. The 11.3% increase nevertheless left applications 45.4% below the peak reached this [...]
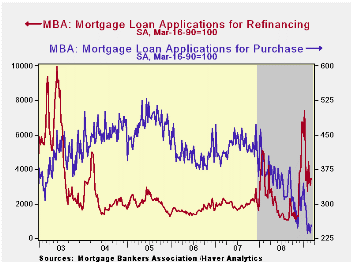
The total number of mortgage applications recovered last week after three consecutive weeks of decline, reported the Mortgage Bankers Association. The 11.3% increase nevertheless left applications 45.4% below the peak reached this past January when applications were boosted by the precipitous decline in interest rates to near the lows of 2003.
The index of applications to refinance a home mortgage recovered 13.3% last week and that reversed nearly all of the prior period's 15.3% decline. While these applications are down by one-half from their January high, the trend still is up due to the decline in interest rates.
Applications for a mortgage to purchase a home also rose last week. The 7.1% increase was enough to recover nearly all of the decline during the prior two weeks. The falloff in home sales continued, however, to pull purchase applications sharply lower. Since their peak early last year these applications are down nearly 50%.
The effective interest rate on a conventional 15-year mortgage
fell week-to-week to 4.84%. That was near the lowest level since 2003
after which home sales surged. For a 30-year mortgage, rates held near
their recent lows at 5.19%. Interest rates on 15- and 30-year mortgages
are closely correlated (>90%) with the rate on 10-year Treasury
securities. For an adjustable 1-Year mortgage, the rate ticked up
slightly week-to-week to 6.25% but the rate still was down sharply from
the 7.07% peak reached this past Fall.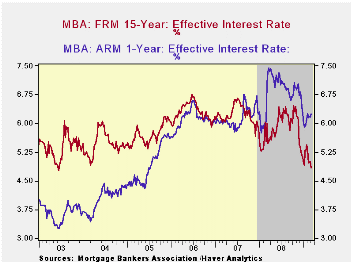
During the last ten years there has been a (negative) 79% correlation between the level of applications for purchase and the effective interest rate on a 30-year mortgage. Moreover, during the last ten years there has been a 61% correlation between the y/y change in purchase applications and the change in new plus existing single family home sales.
The figures for weekly mortgage applications are available in Haver's SURVEYW database.
The Mortgage Bankers Association surveys between 20 to 35 of the top lenders in the U.S. housing industry to derive its refinance, purchase and market indexes. The weekly survey covers roughly 50% of all U.S. residential mortgage applications processed each week by mortgage banks, commercial banks and thrifts. Visit the Mortgage Bankers Association site here.
The Affordability of Homeownership to Middle-Income Americans from the Federal Reserve Bank of Kansas City can be found here.
| MBA Mortgage Applications (3/16/90=100) | 03/06/09 | 02/27/09 | Y/Y | 2008 | 2007 | 2006 |
|---|---|---|---|---|---|---|
| Total Market Index | 723.4 | 649.7 | 7.7% | 642.9 | 652.6 | 584.2 |
| Purchase | 253.3 | 236.4 | -31.3% | 345.4 | 424.9 | 406.9 |
| Refinancing | 3,470.7 | 3,063.4 | 41.8% | 2,394.1 | 1,997.9 | 1,634.0 |
by Tom Moeller March 11, 2009
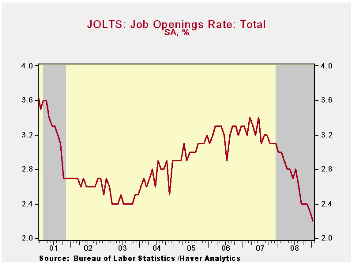
The Bureau of Labor Statistics indicated in its January report on Job Openings & Labor Turnover Survey (JOLTS) that job availability fell 7.2% from December and by more than one-third from the June 2007 peak. The latest level was a record low for the series which dates back to December 2000.
The job openings rate also fell. The January rate was down to 2.2% versus an upwardly revised 2.3% rate in December, down from more than a 3% rate in 2007. The job openings rate is the number of job openings on the last business day of the month as a percent of total employment plus job openings.
The actual number of job openings in the construction and manufacturing sectors fell by roughly two-thirds from the 2007 averages. Professional & business services job openings fell by one-third year-to-year while openings in the education & health sectors also were weak and they fell 7.6%. Openings in retail trade fell a slight 0.3% y/y.
By region, openings in the South, the Midwest and the West were down by roughly one third year-to-year and in the Northeast they were down by one quarter.
The hires rate held steady versus December
at 3.3% which was still near the lowest in the series' short eight year
history.The hires rate is the number of hires during the month
divided by employment.The actual number of hires fell by
11.9% year-to-year. The construction sector showed a 4.3% increase
versus last year but elsewhere hires were quite weak. In the factory
sector, hires fell 33.5% y/y and in the professional & business
services sector they fell 14.8%. In the leisure and hospitality sector,
hires fell 18.1% y/y. Even in the educational & health sector
hires fell 5.0%.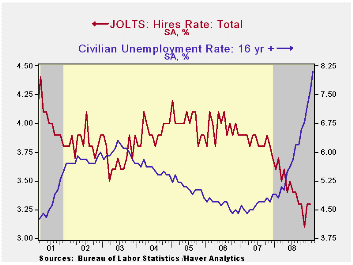
The job separations rate held steady at 3.6%, about where it's been since early 2008. Separations include quits, layoffs, discharges, and other separations as well as retirements. The level of job separations fell 3.5% y/y.
The JOLTS survey dates only to December 2000 but has followed the movement in nonfarm payrolls, though the actual correlation between the two series is low.
A description of the Jolts survey and the latest release from the U.S. Department of Labor is available here and the figures are available in Haver's USECON database.
Explaining trends in wages, work and occupations from the Federal Reserve Bank of Chicago is available here.
| JOLTS (Job Openings & Labor Turnover Survey) | January | December | January '08 | 2008 | 2007 | 2006 |
|---|---|---|---|---|---|---|
| Job Openings, Total | ||||||
| Rate (%) | 2.2 | 2.3 | 3.0 | 2.3 | 3.1 | 3.3 |
| Total (000s) | 2,991 | 3,224 | 4,332 | 3,224 | 4,382 | 4,606 |
| Hires, Total | ||||||
| Rate (%) | 3.3 | 3.3 | 3.6 | 41.1 | 46.1 | 47.6 |
| Total (000s) | 4,399 | 4,508 | 4,995 | 56,486 | 63,666 | 64,879 |
by Tom Moeller March 11, 2009
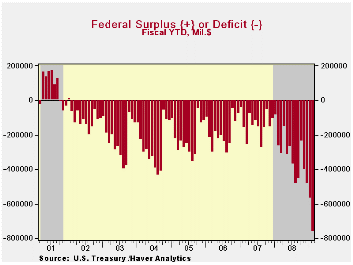
The U.S. government ran a budget deficit of $192.8 billion
during February and for the first five months of this fiscal year the
deficit swelled to $764.5B. Both figures are substantially higher than
the deficits of $175.6B last February and $264.5B for the first five
months of FY08. The latest figure came in slightly below Consensus
projections for a February deficit of $203B.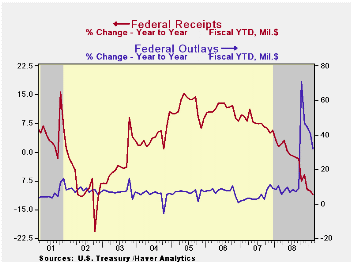
Year-to-date the budget deficit is running at roughly 5.5% of GDP. The Congressional Budget Office's recent deficit estimate of $1.2 trillion for FY09 amounts to 8.3% of GDP. It assumes that revenues will fall 6.6% year-to-year and that outlays will increase 19.0%.
Net revenues during February fell 17.4% from February of last year and for the first five months of FY09 they were down 11.0% y/y. Individual income tax receipts fell 13.1 % y/y through February reflecting higher unemployment. Corporate tax receipts mirror the drying up of profitability and fell by nearly one-half. Growth in employment taxes dropped to 0.9%, the least since late 2003, and unemployment insurance tax receipts fell 9.9%. Real estate taxes fell 6.2% after 10.5% growth last year.
Swelled by TARP, U.S. government outlays surged by 32.0% from last fiscal year's first five months. Outlays under the Government's Troubled Asset Relief Program (TARP) amounted to $37.8B last month and for the first four months of the program totaled $280.3B. The U.S. Treasury has adopted the view that these TARP expenditures should be counted like any other spending. When the banks repay the Treasury, these funds will be counted as revenue. Accounted for in this way, TARP causes a surge in the budget deficit when the funds are distributed to the banks, but leads to a smaller deficit, or perhaps a surplus, when repayments are received.
Defense spending (19% of total outlays) rose 7.1%. Medicare expenditures (12% of outlays) increased by 10.9% and "income security" spending (11% of outlays) jumped 21.1% after 7.5% growth last year. Social security payments rose a steady 7.1% but net interest payments continued to fall by more than one-quarter with lower interest rates.
The Government's financial data are available in Haver's USECON database, with extensive detail available in the specialized GOVFIN.
The Economic Crisis and the Fiscal Crisis: 2009 and Beyond from Alan J. Auerbach, University of California, Berkeley, and William G. Gale, Brookings Institution, is available here.
| US Government Finance | February | January | Y/Y | FY 2008 | FY 2007 | FY 2006 |
|---|---|---|---|---|---|---|
| Budget Balance | -192.8B | $-86.5B | $-175.6B (2/08) |
-$454.8B | -$161.5B | -$248.2B |
| Net Revenues | $87.3B | $226.1B | -17.4% | -1.7% | 6.7% | 11.8% |
| Net Outlays | $280.1B | $131.3B | -0.4% | 9.1% | 2.8% | 7.4% |
by Robert Brusca March 11, 2009
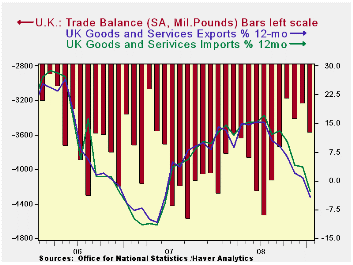
In the UK both export and import flows are losing momentum
fast. Weak exports tell a tale of weakening growth in UK export
markets. Dropping imports tell of still weakening domestic demand. Both
series are quite weak and have a record of tracking one another
relatively closely. The deficit in goods and services trade widened
this month but the trends still seems to show a contraction phase is in
train (see chart). While exports fell more steeply than imports in
January, the two months of January and December taken together show
much more similar behavior.
The trade gap is currently 41% of exports which is not far
from its peak ratio of nearly 45% (since 1990). The deficit is also 29%
of imports which is close to its max ratio of 31%. So while the deficit
has been gradually on the decline the size of the deficit relative to
the trade flows is expanding, effectively increasing its burden.
Year-over-year UK export and import values are lower by about
7% and 6% respectively. But over the recent periods we get a better
taste of what is really in train. The annualized rate drop for exports
is 38% over three months compared to 28% for imports. Over six months
it’s 31% for exports compared to 25% for imports. Obviously the
unraveling has been recent and has some on with great vigor. Sterling
has dropped during this period, something that should help the UK to
hold its trade competitiveness. However, that makes things more
difficult for exporters based in the euro-Zone, trying to penetrate the
UK market and it has been the source of some UK e-Zone tensions.
| m/m% | % Saar | ||||
| Jan-09 | Dec-08 | 3M | 6M | 12M | |
| Balance* | -££ 7.75 | -££ 7.23 | -££ 7.61 | -££ 7.66 | -££ 7.72 |
| Exports | |||||
| All Exp | -4.0% | -1.8% | -37.8% | -31.0% | -6.7% |
| Capital gds | -6.7% | 0.5% | -24.7% | -13.0% | -5.5% |
| Road Vehicles | -6.0% | -12.2% | -68.0% | -58.9% | -34.5% |
| Basic Materials | -14.6% | 7.9% | -79.6% | -75.2% | -23.4% |
| Food Feed Bev & Tbco | -0.3% | 7.3% | 13.5% | 5.4% | 8.2% |
| IMPORTS | |||||
| All IMP | -1.0% | -3.5% | -27.9% | -25.5% | -5.7% |
| Capital gds | -4.8% | -4.8% | -20.1% | -13.9% | -8.8% |
| Road Vehicles | -0.3% | -11.9% | -70.3% | -57.1% | -43.9% |
| Basic Materials | -15.2% | -4.5% | -61.8% | -53.4% | -30.2% |
| Food Feed Bev & Tbco | 3.2% | -4.1% | 14.4% | 5.3% | 10.9% |
| *Stg Blns; mo or period average | |||||

Tom Moeller
AuthorMore in Author Profile »Prior to joining Haver Analytics in 2000, Mr. Moeller worked as the Economist at Chancellor Capital Management from 1985 to 1999. There, he developed comprehensive economic forecasts and interpreted economic data for equity and fixed income portfolio managers. Also at Chancellor, Mr. Moeller worked as an equity analyst and was responsible for researching and rating companies in the economically sensitive automobile and housing industries for investment in Chancellor’s equity portfolio. Prior to joining Chancellor, Mr. Moeller was an Economist at Citibank from 1979 to 1984. He also analyzed pricing behavior in the metals industry for the Council on Wage and Price Stability in Washington, D.C. In 1999, Mr. Moeller received the award for most accurate forecast from the Forecasters' Club of New York. From 1990 to 1992 he was President of the New York Association for Business Economists. Mr. Moeller earned an M.B.A. in Finance from Fordham University, where he graduated in 1987. He holds a Bachelor of Arts in Economics from George Washington University.
More Economy in Brief


