 Global| Oct 09 2008
U.S. Weekly Initial Jobless Insurance Claims Fell But Still Near Cycle High
by:Tom Moeller
|in:Economy in Brief
Summary
Last week, initial claims for unemployment insurance fell 20,000 from the previous week's cycle high of 498,000, which was a level revised up slightly.The four-week moving average also moved to a new high for this cycle of 482,500 [...]
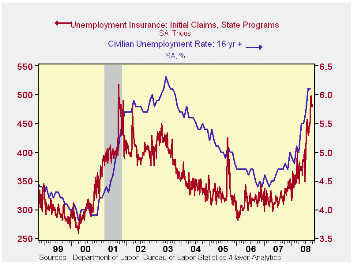
Last week, initial claims for unemployment insurance fell 20,000 from the previous week's cycle high of 498,000, which was a level revised up slightly.The four-week moving average also moved to a new high for this cycle of 482,500 (52.2% y/y). During September initial claims averaged 474,000.
A claims level below 400,000 typically has been associated
with positive job growth. During the last ten years there has been a
(negative) 76% correlation between the level of initial claims and the
m/m change in nonfarm payroll employment. Over the longer period of
time, the level of claims for jobless insurance has not trended higher
with the size of the labor force due to a higher proportion of
self-employed workers who are not eligible for benefits.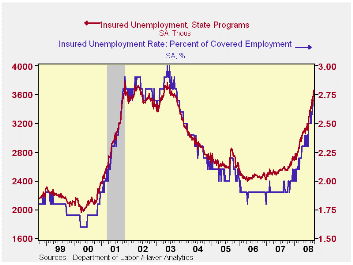
By state through August, larger y/y increases in initial claims occurred in North Dakota (101.8%), Louisiana (96.8%), Maine (85.9%), Georgia (70.7%), Indiana (59.5%), Ohio (45.1%), South Carolina (40.1%) and California (23.0%).
Gains in initial claims have been more moderate in Michigan (16.8%), Virginia (14.4%), Wisconsin (12.7%), New York (9.6%), Pennsylvania (8.3%), Massachusetts (6.3%) and New Jersey (2.7%),
Continuing claims for unemployment insurance during the latest week rose 56,000 following an upwardly revised 60,000 increase during the prior period. The four-week average of claims rose to 3,563,250, the highest level since 2003. Continuing claims provide some indication of workers' ability to find employment and they lag the initial claims figures by one week.
The insured rate of unemployment held steady at 2.7% for the third consecutive week, also the highest level since late-2003.
The geography of research and development activity in the U.S.* from the Federal Reserve Bank of Philadelphia is available here.
| Unemployment Insurance (000s) | 10/04/08 | 09/27/08 | Y/Y | 2007 | 2006 | 2005 |
|---|---|---|---|---|---|---|
| Initial Claims | 478 | 498 | 51.3% | 322 | 313 | 331 |
| Continuing Claims | -- | 3,659 | 43.9 | 2,552 | 2,459 | 2,662 |
by Robert Brusca October 9, 2008
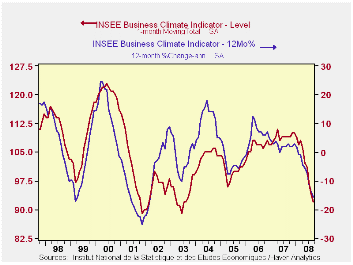
The INSEE business climate indicator fell to 92 in September
from 94 in August. It now stands in the 38th percentile of its range
since 1990. The likely trends assessment by participants at a -41
reading is in the 16th percentile of its historic range of values.
Foreign and domestic orders are hovering near the 40th percentile of
their respective ranges. The likely sales price trend is still in the
80th percentile indicating that more upward movement is expected. By
count the headline is weaker than this only 22 percentile of the time
and the likely trend of output is weaker than this only 7% to 8% of the
time. This is a weak survey.
| INSEE Industry Survey | ||||||||||
|---|---|---|---|---|---|---|---|---|---|---|
| Since Jan 1990 | Since Jan 1990 | |||||||||
| Sep 08 |
Aug 08 |
Jul 08 |
Jun 08 |
%tile | Rank | Max | Min | Range | Mean | |
| Climate | 92 | 94 | 97 | 101 | 38.0 | 171 | 123 | 73 | 50 | 101 |
| Production | ||||||||||
| Recent Trend | -41 | -38 | -34 | -15 | 16.7 | 205 | 44 | -58 | 102 | -6 |
| Likely trend | -8 | -4 | -1 | 6 | 28.3 | 205 | 30 | -23 | 53 | 6 |
| Orders/Demand | ||||||||||
| Orders&Demand | -24 | -22 | -19 | -13 | 43.7 | 163 | 25 | -62 | 87 | -14 |
| FgnOrders&Demand | -25 | -20 | -14 | -6 | 37.1 | 175 | 31 | -58 | 89 | -10 |
| Prices | ||||||||||
| Likely Sales Price Trend | 15 | 17 | 19 | 15 | 80.9 | 19 | 24 | -23 | 47 | 1 |

Tom Moeller
AuthorMore in Author Profile »Prior to joining Haver Analytics in 2000, Mr. Moeller worked as the Economist at Chancellor Capital Management from 1985 to 1999. There, he developed comprehensive economic forecasts and interpreted economic data for equity and fixed income portfolio managers. Also at Chancellor, Mr. Moeller worked as an equity analyst and was responsible for researching and rating companies in the economically sensitive automobile and housing industries for investment in Chancellor’s equity portfolio. Prior to joining Chancellor, Mr. Moeller was an Economist at Citibank from 1979 to 1984. He also analyzed pricing behavior in the metals industry for the Council on Wage and Price Stability in Washington, D.C. In 1999, Mr. Moeller received the award for most accurate forecast from the Forecasters' Club of New York. From 1990 to 1992 he was President of the New York Association for Business Economists. Mr. Moeller earned an M.B.A. in Finance from Fordham University, where he graduated in 1987. He holds a Bachelor of Arts in Economics from George Washington University.
More Economy in Brief


