 Global| Dec 03 2009
U.S. Weekly Initial Claims For Jobless Insurance Fall Further
by:Tom Moeller
|in:Economy in Brief
Summary
The improved economy pushed initial claims for unemployment insurance down to a 15-month low. The Labor Department indicated that during the latest week, which included the Thanksgiving holiday, claims fell to 457,000 from a [...]
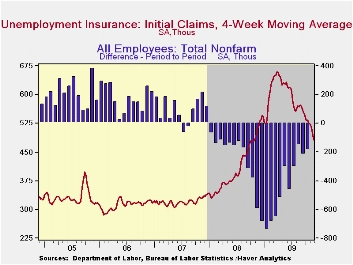 The improved
economy pushed initial claims for unemployment insurance down to a
15-month low. The Labor Department indicated that during the latest
week, which included the Thanksgiving holiday, claims fell to 457,000
from a downwardly revised 462,000 during the prior period. The figures
are down from the recession peak of 674,000 claims reached in March.
The four-week moving average of claims fell to 481,250 and the latest
weekly figure was lower than Consensus expectations for and increase to
488,000 claims.
The improved
economy pushed initial claims for unemployment insurance down to a
15-month low. The Labor Department indicated that during the latest
week, which included the Thanksgiving holiday, claims fell to 457,000
from a downwardly revised 462,000 during the prior period. The figures
are down from the recession peak of 674,000 claims reached in March.
The four-week moving average of claims fell to 481,250 and the latest
weekly figure was lower than Consensus expectations for and increase to
488,000 claims.
 Continuing
claims for unemployment insurance
during
the latest week inched up by 28,000 after a 176,000 decline during the
week prior which was much greater than reported initially. Continuing
claims were at the lowest level since late-February. The decline is a
function of the improved job market but also reflects the exhaustion of
unemployment benefits. Continuing claims provide an indication of
workers' ability to find employment. The four-week average of
continuing claims fell to 5,541,500. This series dates back to
1966.
Continuing
claims for unemployment insurance
during
the latest week inched up by 28,000 after a 176,000 decline during the
week prior which was much greater than reported initially. Continuing
claims were at the lowest level since late-February. The decline is a
function of the improved job market but also reflects the exhaustion of
unemployment benefits. Continuing claims provide an indication of
workers' ability to find employment. The four-week average of
continuing claims fell to 5,541,500. This series dates back to
1966.
Extended benefits for unemployment insurance rose w/w to a cycle high of 597,688 during the second week of November. The latest was versus 550,343 during all of October.
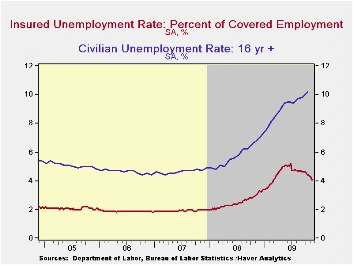
The insured rate of unemployment remained stable at 4.1% and matched its lowest since late-March. The rate reached a high of 5.2% during late-June. During the last ten years, there has been a 93% correlation between the level of the insured unemployment rate and the overall rate of unemployment published by the Bureau of Labor Statistics.
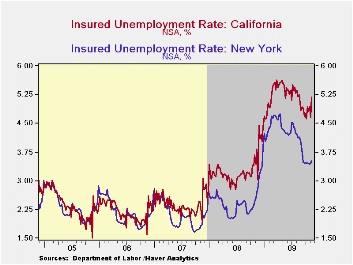 The
highest insured unemployment rates in the week ending November 14
were in Puerto Rico (6.1%), Oregon (5.9), Alaska (5.5), Nevada
(5.2), California (5.2), Michigan (5.1), Wisconsin (5.0),
Pennsylvania (5.0), and South Carolina (4.5). The lowest insured
unemployment rates were in North Dakota (1.2%), Virginia (2.0), Texas
(2.5), Maine (2.9), Wyoming (2.9), Maryland (3.1), Ohio (3.5), New York
(3.5), Mississippi (3.5) and Florida (3.7). Most of these rates are
slightly higher than their recent low. However, the data are not
seasonally adjusted but the overall insured unemployment rate is.· The
unemployment insurance claims data is available in Haver's WEEKLY
database and the state data is in the REGIONW
database.
The
highest insured unemployment rates in the week ending November 14
were in Puerto Rico (6.1%), Oregon (5.9), Alaska (5.5), Nevada
(5.2), California (5.2), Michigan (5.1), Wisconsin (5.0),
Pennsylvania (5.0), and South Carolina (4.5). The lowest insured
unemployment rates were in North Dakota (1.2%), Virginia (2.0), Texas
(2.5), Maine (2.9), Wyoming (2.9), Maryland (3.1), Ohio (3.5), New York
(3.5), Mississippi (3.5) and Florida (3.7). Most of these rates are
slightly higher than their recent low. However, the data are not
seasonally adjusted but the overall insured unemployment rate is.· The
unemployment insurance claims data is available in Haver's WEEKLY
database and the state data is in the REGIONW
database.
The Fed's latest Beige Book covering regional economic conditions can be found here.
| Unemployment Insurance (000s) | 11/28/09 | 11/21/09 | 11/14/09 | Y/Y | 2008 | 2007 | 2006 |
|---|---|---|---|---|---|---|---|
| Initial Claims | 457 | 462 | 501 | -11.6% | 420 | 321 | 313 |
| Continuing Claims | -- | 5,465 | 5,437 | 33.2% | 3,342 | 2,552 | 2,459 |
| Insured Unemployment Rate (%) | -- | 4.1 | 4.1 | 3.1 (11/2008) | 2.5 | 1.9 | 1.9 |
by Tom Moeller December 3, 2009
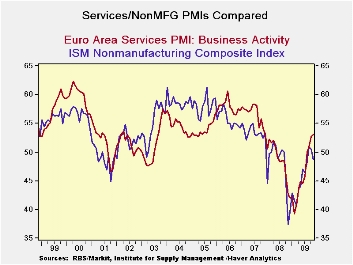
In November the Services PMI rose to 53.04 from 52.58. The
services PMI stands in the 63rd percentile of its range. As such it is
stronger than the EMU commission index for the sector that is only in
the 47th percentile of its range.
Among EMU nations France’s index is the relative strongest standing in
the 81st percentile of its range. Ireland is the relative weakest with
the services index standing in the 40th percentile of its range.
Interestingly the service sector has continued to improve with little
or no improvement in consumer confidence (see bottom panel of table
above).
The service sector is important since it is where most of the jobs are.
Despite ongoing sector improvement consumers have simply not had their
spirits lifted. In Germany the banks continue to be obstreperous about
lending. In the UK the service sector is backing off. France is doing
well but at the cost of its fiscal progress. To be sure the various
counties of the e-Zone and of EU remain challenged. E-Zone lending has
been slow to revive. But getting the service sector back on track is a
key objective of mending the Euro-economy. That revival should fix a
lot of what is wrong.
The improved economy pushed initial claims for unemployment insurance
down to a 15-month low. The Labor Department indicated that during the
latest week, which included the Thanksgiving holiday, claims fell to
457,000 from a downwardly revised 462,000 during the prior period. The
figures are down from the recession peak of 674,000 claims reached in
March. The four-week moving average of claims fell to 481,250 and the
latest weekly figure was lower than Consensus expectations for and
increase to 488,000 claims.
| Markit Services Indices for EU/EMU | |||||||
|---|---|---|---|---|---|---|---|
| Nov-09 | Oct-09 | Sep-09 | 3Mo | 6Mo | 12Mo | Percentile | |
| Euro-Area | 53.04 | 52.58 | 50.86 | 52.16 | 49.46 | 45.81 | 63.8% |
| Germany | 51.38 | 50.73 | 52.06 | 51.39 | 50.21 | 47.13 | 51.2% |
| France | 60.87 | 57.71 | 53.16 | 57.25 | 52.29 | 47.96 | 81.5% |
| Italy | 49.84 | 52.20 | 48.53 | 50.19 | 47.31 | 43.94 | 48.0% |
| Spain | 46.13 | 47.74 | 46.39 | 46.75 | 44.60 | 39.90 | 54.8% |
| Ireland | 46.80 | 47.37 | 45.46 | 46.54 | 45.16 | 39.85 | 40.8% |
| EU only | |||||||
| UK (CIPs) | 56.63 | 56.90 | 55.30 | 56.28 | 54.63 | 49.96 | 80.8% |
| EU Commission Indices for EU and EMU | |||||||
| EU Index | Nov-09 | Oct-09 | Sep-09 | 3Mo | 6Mo | 12Mo | Percentile |
| EU Services | -9 | -11 | -11 | -18.00 | -20.67 | -26.00 | 47.2% |
| EMU | Nov-09 | Oct-09 | Sep-09 | 3Mo | 6Mo | 12Mo | Percentile |
| Services | -4 | -7 | -9 | -6.67 | -11.50 | -18.96 | 36.2% |
| Cons Confidence | -17 | -18 | -19 | -18.00 | -20.67 | -21.31 | 47.2% |
| Consumer confidence by country | |||||||
| Germany-Ccon | -19 | -16 | -19 | -18.00 | -22.00 | -25.92 | 32.6% |
| France-Ccon | -18 | -21 | -24 | -21.00 | -25.33 | -29.92 | 47.5% |
| Ital-Ccon | -17 | -18 | -16 | -17.00 | -17.17 | -22.33 | 42.9% |
| UK-Ccon | -8 | -8 | -10 | -8.67 | -12.67 | -20.00 | 71.1% |
| percentile is over range since May 2000 | |||||||
by Robert Brusca December 3, 2009
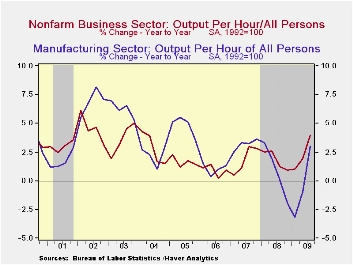
Last quarter's strength in productivity growth was revised
lower with the reduced reading on GDP. Nevertheless, the revised 8.1%
jump remained the strongest since 3Q '03 and fell just short of
Consensus expectations for an 8.5% increase.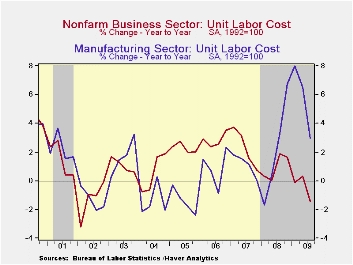
The revision reflected a downwardly revised 2.9% (-3.7% y/y) increase in output. Hours-worked (employment times hours) was little-revised at down 4.8% (-7.4% y/y) which followed a 7.5% 2Q drop.Compensation costs, however, were revised up significantly to a 5.4% quarterly rate of growth and by 2.5% y/y.
The downward revision of productivity and the upward revision to compensation lessened the previously reported decline in unit labor costs. Nevertheless, the 2.5% decline remained the third consecutive quarterly fall but it eased the y/y change to -1.4%.
The surge in 3Q worker productivity growth in the factory sector was revised little at a 13.4% (AR) increase. That was a record and it lifted y/y growth to 3.0%, the highest since early-last year. The increase came as output rose at an 8.4% rate (-10.7% y/y) and hours worked fell at a 4.4% rate (-13.3% y/y). Compensation rose at an upwardly revised 6.5% rate (6.1% y/y), therefore unit labor costs in the factory sector fell at a lessened 6.1% annual rate (+3.0% y/y).
The productivity & cost figures are available in Haver's USECON database.
Fed Chairman Ben S. Bernanke's Senate testimony today can be found here.
| Nonfarm Business Sector (SAAR, %) | 3Q '09 (Revised) | 3Q '09 (Prelim.) | 2Q '09 | 1Q '08 | Y/Y | 2008 | 2007 | 2006 |
|---|---|---|---|---|---|---|---|---|
| Output per Hour | 8.1 | 9.5 | 6.9 | 0.3 | 4.0 | 1.8 | 1.9 | 0.9 |
| Compensation per Hour | 5.4 | 3.8 | 6.9 | -4.7 | 2.5 | 2.8 | 4.2 | 3.8 |
| Unit Labor Costs | -2.5 | -5.2 | -0.0 | -5.0 | -1.4 | 1.0 | 2.3 | 2.8 |
| Manufacturing Sector | ||||||||
| Output per Hour | 13.4 | 13.6 | 6.8 | -2.5 | 3.0 | 0.8 | 3.2 | 1.0 |
| Compensation per Hour | 6.5 | 5.5 | 6.5 | -0.4 | 6.1 | 3.0 | 4.3 | 2.0 |
| Unit Labor Costs | -6.1 | -7.1 | -0.3 | 2.2 | 3.0 | 2.2 | 1.1 | 0.9 |
by Tom Moeller December 3, 2009
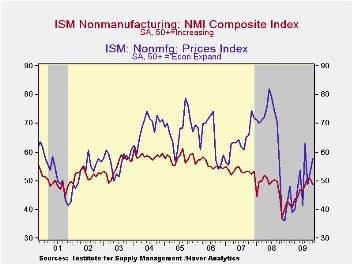
Unexpectedly, the November Composite Index for the nonmanufacturing sector deteriorated for the second consecutive month. The figure from the Institute for Supply Management (ISM) fell below the break-even level of 50 to 48.7 and fell short of Consensus expectations for a reading of 51.2. Since the series' inception in 1997 there has been a 64% correlation between the level of the composite index in the nonmanufacturing sector and the Q/Q change in real GDP for the services and the construction sectors.
ISM surveys more than 370 purchasing managers in more than 62
industries including law firms, hospitals, government and retailers.
The nonmanufacturing survey dates back to July 1997. The figures are
available in Haver's USECON database.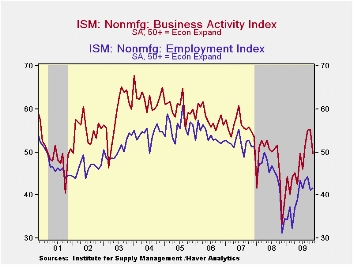
Amongst the components, the business activity index for the service sector fell the hardest to 49.6 and just below the break-even level. The new orders series also fell slightly to 55.1 but remained up from November's low of 35.6. The speed of vendor deliveries increased (lower index level) to its quickest since June. Only the employment index showed slight improvement m/m but it remained well below the September level. Since the series' inception in 1997 there has been an 80% correlation between the level of the ISM nonmanufacturing employment index and the m/m change in payroll employment in the service-producing plus the construction industries.
Pricing power increased slightly despite the weakening in business activity. The pricing index rose m/m 57.9 and was up sharply from the December low of 36.1. Since its inception ten years ago, there has been a 73% correlation between the price index and the q/q change in the GDP services chain price index.
Beginning with the January 2008 Nonmanufacturing Report On Business®, the composite index is calculated as an indicator of the overall economic condition for the non-manufacturing sector. It is a composite index based on the diffusion indices of four of the indicators (business activity, new orders, employment and supplier deliveries) with equal weights. The latest report from the ISM can be found here.
| ISM Nonmanufacturing Survey | November | October | September | Nov. '08 | 2008 | 2007 | 2006 |
|---|---|---|---|---|---|---|---|
| Composite Index | 48.7 | 50.6 | 50.9 | 37.4 | 47.4 | 53.5 | 55.7 |
| Business Activity | 49.6 | 55.2 | 55.1 | 33.3 | 47.4 | 56.0 | 58.0 |
| New Orders | 55.1 | 55.6 | 54.2 | 35.6 | 47.0 | 54.8 | 57.1 |
| Employment | 41.6 | 41.1 | 44.3 | 31.1 | 43.8 | 52.0 | 53.8 |
| Supplier Deliveries | 48.5 | 50.5 | 50.0 | 49.5 | 51.1 | 51.1 | 53.8 |
| Prices Index | 57.8 | 53.0 | 48.8 | 37.0 | 66.0 | 63.8 | 65.3 |

Tom Moeller
AuthorMore in Author Profile »Prior to joining Haver Analytics in 2000, Mr. Moeller worked as the Economist at Chancellor Capital Management from 1985 to 1999. There, he developed comprehensive economic forecasts and interpreted economic data for equity and fixed income portfolio managers. Also at Chancellor, Mr. Moeller worked as an equity analyst and was responsible for researching and rating companies in the economically sensitive automobile and housing industries for investment in Chancellor’s equity portfolio. Prior to joining Chancellor, Mr. Moeller was an Economist at Citibank from 1979 to 1984. He also analyzed pricing behavior in the metals industry for the Council on Wage and Price Stability in Washington, D.C. In 1999, Mr. Moeller received the award for most accurate forecast from the Forecasters' Club of New York. From 1990 to 1992 he was President of the New York Association for Business Economists. Mr. Moeller earned an M.B.A. in Finance from Fordham University, where he graduated in 1987. He holds a Bachelor of Arts in Economics from George Washington University.
More Economy in Brief


