 Global| Sep 03 2009
U.S. Weekly Claims For Jobless Insurance Slip Modestly
by:Tom Moeller
|in:Economy in Brief
Summary
Initial claims for unemployment insurance indicate that the labor market improved just modestly. For last week, the Labor Department indicated that claims fell a scant 4,000 to 570,000. Though the decline was the second in a row, the [...]
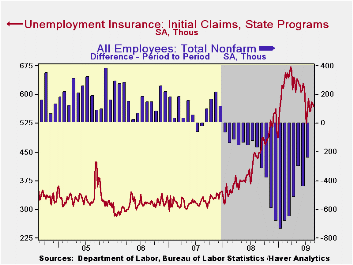 Initial
claims for unemployment insurance indicate that the labor market
improved just modestly. For last week, the Labor Department indicated
that claims fell a scant 4,000 to 570,000. Though the decline was the
second in a row, the average for last month rose slightly to 571,000
from 559,000 during July. A decline in weekly claims to 560,000 had
been expected.
Initial
claims for unemployment insurance indicate that the labor market
improved just modestly. For last week, the Labor Department indicated
that claims fell a scant 4,000 to 570,000. Though the decline was the
second in a row, the average for last month rose slightly to 571,000
from 559,000 during July. A decline in weekly claims to 560,000 had
been expected.
The Labor Department indicated that the largest increases in initial claims for the week ending August 22 were in California (+8,632, +35.5% y/y), Ohio (+2,018, 52.5% y/y), New Hampshire (+1,237, +117.9% y/y), Wisconsin (+906, +58.0% y/y), and Minnesota (+664, +64.1% y/y), while the largest decreases were in Michigan (-2,968, +3.2% y/y), Florida (-1,653, +31.8% y/y), Pennsylvania (-1,288, +60.9% y/y), New Jersey (-1,271, -2.9% y/y), and Alabama (-1,266, +9.5% y/y).
Continuing claims for unemployment
insurance during the latest week rose and reversed most of the prior
period's decline. They remained down by nearly 10% from their late-June
high, a decline which probably owes to the exhaustion of benefits.
Continuing claims provide an indication of workers' ability to find
employment and the level of 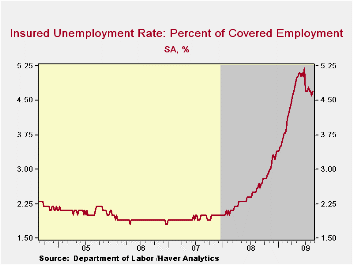 6,234,000 claims is up sharply
from the year-ago level. The four-week average of
continuing claims fell modestly to 6,216,750, near the lowest since
late-April. The series dates back to 1966.
6,234,000 claims is up sharply
from the year-ago level. The four-week average of
continuing claims fell modestly to 6,216,750, near the lowest since
late-April. The series dates back to 1966.
Extended benefits for unemployment insurance have risen sharply indicating that worker rehiring continued weak. Though they fell in the latest week, through mid-August extended benefits averaged 446,974 versus 416,630 during July.
The insured rate of unemployment ticked up to 4.7%, but that still was near the lowest level since mid-April. The rate reached a high of 5.2% during late-June. During the last ten years, there has been a 93% correlation between the level of the insured unemployment rate and the overall rate of unemployment published by the Bureau of Labor Statistics.
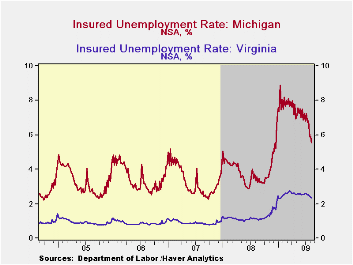 The
highest insured unemployment rates in
the week ending August 15 were in Puerto Rico (7.3 percent), Oregon
(6.0), Pennsylvania (6.0), Nevada (5.7), Michigan (5.5), Wisconsin
(5.4), Connecticut (5.3), California (5.2), New Jersey (5.2), and North
Carolina (5.0). The lowest rates were in South Dakota (1.3) and North
Dakota (1.5), Virginia (2.4), Wyoming (2.8), Texas (2.9), Maine (3.0),
Colorado (3.2), Maryland (3.5), Minnesota (3.6), New York (4.2),
Mississippi (4.2), Georgia (4.2), and Florida (4.3).
The
highest insured unemployment rates in
the week ending August 15 were in Puerto Rico (7.3 percent), Oregon
(6.0), Pennsylvania (6.0), Nevada (5.7), Michigan (5.5), Wisconsin
(5.4), Connecticut (5.3), California (5.2), New Jersey (5.2), and North
Carolina (5.0). The lowest rates were in South Dakota (1.3) and North
Dakota (1.5), Virginia (2.4), Wyoming (2.8), Texas (2.9), Maine (3.0),
Colorado (3.2), Maryland (3.5), Minnesota (3.6), New York (4.2),
Mississippi (4.2), Georgia (4.2), and Florida (4.3).
The unemployment insurance claims data is available in Haver's WEEKLY database and the state data is in the REGIONW database.
The minutes from the latest FOMC meeting can be found here.
| Unemployment Insurance (000s) | 08/29/09 | 08/22/09 | 08/15/09 | Y/Y | 2008 | 2007 | 2006 |
|---|---|---|---|---|---|---|---|
| Initial Claims | 570 | 574 | 580 | 26.7% | 420 | 321 | 313 |
| Continuing Claims | -- | 6,234 | 6,142 | 80.9% | 3,342 | 2,552 | 2,459 |
| Insured Unemployment Rate (%) | -- | 4.7 | 4.6 | 2.6 (08/2008) | 2.5 | 1.9 | 1.9 |
by Tom Moeller September 3, 2009
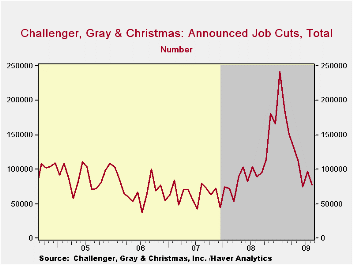
The outplacement firm of Challenger, Grey & Christmas indicated that job cut announcements returned last month to near this cycle's low. They fell to 76,456 after having ticked up during July. The figures remain well below this cycle's peak level of layoffs which occurred this past January when there were 241,749 cuts.
During the last ten years there has been a 67% (inverse) correlation between the three month moving average of announced job cuts and the three month change payroll employment. Job cut announcements differ from layoffs. Many are achieved through attrition, early retirement or just never occur.
The problem with the reduction in job cuts is that, while hiring plans are up 34.1% from last year, the level remains low.
The Challenger figures are available in Haver's SURVEYS database.
The Exchange Rate: What's in It for Prices? from the Federal Reserve Bank of Philadelphia is available here.
| Challenger, Gray & Christmas | August | July | Y/Y | 2008 | 2007 | 2006 |
|---|---|---|---|---|---|---|
| Announced Job Cuts | 76,456 | 97,373 | -13.8% | 1,223,993 | 768,264 | 839,822 |
| Announced Hiring Plans | 13,100 | 17,183 | 34.1 | 118,600 | 365,753 | 276,525 |
by Tom Moeller September 3, 2009
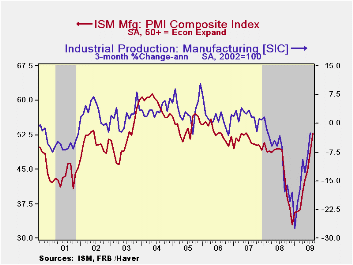 Improvement
in service sector activity regained its legs last month. The Composite
Index for the nonmanufacturing sector from the Institute for Supply
Management (ISM) rose to 48.4 last month after having slipped to 46.4
during July. The latest level was the highest since September of last
year and the figure about matched Consensus expectations for a reading
of 48.0. A level of the ISM index below 50 indicates declining
activity. Since the series' inception in 1997 there has been a 65%
correlation between the level of the business activity index in the
nonmanufacturing sector and the Q/Q change in real GDP for the services
and the construction sectors.
Improvement
in service sector activity regained its legs last month. The Composite
Index for the nonmanufacturing sector from the Institute for Supply
Management (ISM) rose to 48.4 last month after having slipped to 46.4
during July. The latest level was the highest since September of last
year and the figure about matched Consensus expectations for a reading
of 48.0. A level of the ISM index below 50 indicates declining
activity. Since the series' inception in 1997 there has been a 65%
correlation between the level of the business activity index in the
nonmanufacturing sector and the Q/Q change in real GDP for the services
and the construction sectors.
ISM surveys more than 370 purchasing
managers in more than 62 industries including law firms, hospitals,
government and retailers. 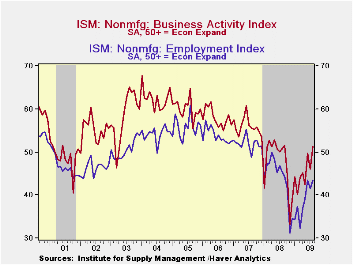 The nonmanufacturing survey dates back to
July 1997. The figures are available in Haver's USECON database.
The nonmanufacturing survey dates back to
July 1997. The figures are available in Haver's USECON database.
The improvement in the August index was broad-based amongst the component series. The business activity index for the service sector broached the break-even level for the first time since last September with a rise to 51.3. The new orders series neared that break-even level with an increase to 49.9, up from November's low of 35.6. Finally, the employment index rose to 43.5 and that was the highest level since September. Since the series' inception in 1997 there has been a 56% correlation between the level of the ISM nonmanufacturing employment index and the m/m change in payroll employment in the service-producing plus the construction industries.
The rise in service sector
activity powered a sharp improvement in pricing power. The 21.8 point
m/m jump in the price index to 63.1 placed the index at its
highest level since last September. Twenty-three percent of firms
reported higher prices while a significantly reduced 6%
reporting lower prices.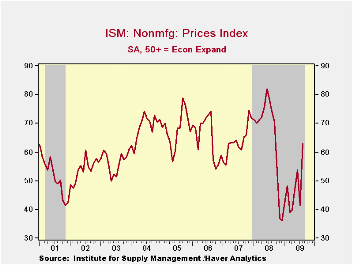 Since its inception ten years ago, there has
been a 60% correlation between the price index and the q/q change in
the GDP services chain price index.
Since its inception ten years ago, there has
been a 60% correlation between the price index and the q/q change in
the GDP services chain price index.
Beginning with the January 2008 Nonmanufacturing Report On Business ®, the composite index is calculated as an indicator of the overall economic condition for the non-manufacturing sector. It is a composite index based on the diffusion indices of four of the indicators (business activity, new orders, employment and supplier deliveries) with equal weights. The latest report from the ISM can be found here.
Changes in the Use of Electronic Means of Payment: 1995-2007 also from the Federal Reserve Bank of Philadelphia is available here.
| ISM Nonmanufacturing Survey | August | July | August '08 | 2008 | 2007 | 2006 |
|---|---|---|---|---|---|---|
| Composite Index | 48.4 | 46.4 | 50.4 | 47.4 | 53.5 | 55.7 |
| Business Activity | 51.3 | 46.1 | 50.8 | 47.4 | 56.0 | 58.0 |
| Employment | 43.5 | 41.5 | 45.6 | 43.8 | 52.0 | 53.8 |
| Prices Index | 63.1 | 41.3 | 74.1 | 66.0 | 63.8 | 65.3 |
by Robert Brusca September 3, 2009
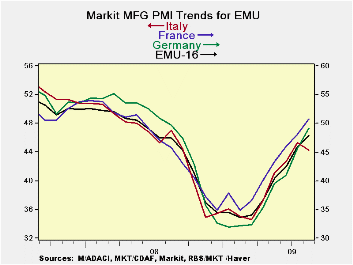
The Markit PMIs turned higher in August. Across the main
reporting Markit economics we find MFG PMIs are over the break-even
mark of 50 in two of seven EU nations. Three others have readings with
a ‘49’ handle. Italy back-slid in August and has the second weakest MFG
reading at 44.24; Ireland’s MFG PMI rose this month but stands at a
weaker level than Italy’s gauge, at 43.98. Still, all the countries in
the table sport PMI readings that reside in the upper 50% of their
range except Italy and Ireland. Country level readings are in the 60th
percentile or better. Greece and France post the highest relative
readings, in the 70th percentile of their respective ranges or better,
For EMU the current reading is 48.24 and that stands in the 60th
percentile, or in the top 40% of its range.
The services readings for August also show widespread
improvement. The jump this month was very large for EMU and the gains
for services spread across all major individually reporting countries
in our six large-country sample.
With both manufacturing and the services sectors are making
strong gains they are boosting the overall EMU composite index which
moved up above the mark of 50, signaling growth. For its part, the OECD
sees an end to the global recession. But it is warning of continued
difficulties and strong head winds. The outlook has improved but the
degree of improvement remains shrouded in caution. No agency is
sticking its neck out to look for strong growth, even though most are
now citing improvement and calls that say the recession is over are
becoming commonplace
| NTC/Markit MFG Indices | |||||||
|---|---|---|---|---|---|---|---|
| Aug-09 | Jul-09 | Jun-09 | 3Mo | 6Mo | 12Mo | Percentile | |
| Euro-13 | 48.24 | 46.25 | 42.62 | 45.70 | 41.43 | 39.34 | 60.9% |
| Germany | 49.17 | 45.65 | 40.88 | 45.23 | 40.51 | 38.81 | 62.5% |
| France | 50.78 | 48.13 | 45.86 | 48.26 | 44.12 | 41.10 | 71.4% |
| Italy | 44.25 | 45.36 | 42.69 | 44.10 | 40.87 | 39.24 | 42.2% |
| Spain | 47.20 | 47.33 | 42.76 | 45.76 | 40.78 | 36.57 | 65.2% |
| Austria | 49.95 | 46.46 | 42.01 | 46.14 | 41.73 | 40.07 | 65.4% |
| Greece | 51.13 | 48.82 | 47.67 | 49.21 | 45.46 | 44.48 | 75.8% |
| Ireland | 43.98 | 43.66 | 42.47 | 43.37 | 40.11 | 39.27 | 48.6% |
| EU | |||||||
| UK | 49.71 | 50.25 | 46.78 | 48.91 | 45.97 | 41.69 | 68.8% |
| percentile is over range since March 2000 | |||||||

Tom Moeller
AuthorMore in Author Profile »Prior to joining Haver Analytics in 2000, Mr. Moeller worked as the Economist at Chancellor Capital Management from 1985 to 1999. There, he developed comprehensive economic forecasts and interpreted economic data for equity and fixed income portfolio managers. Also at Chancellor, Mr. Moeller worked as an equity analyst and was responsible for researching and rating companies in the economically sensitive automobile and housing industries for investment in Chancellor’s equity portfolio. Prior to joining Chancellor, Mr. Moeller was an Economist at Citibank from 1979 to 1984. He also analyzed pricing behavior in the metals industry for the Council on Wage and Price Stability in Washington, D.C. In 1999, Mr. Moeller received the award for most accurate forecast from the Forecasters' Club of New York. From 1990 to 1992 he was President of the New York Association for Business Economists. Mr. Moeller earned an M.B.A. in Finance from Fordham University, where he graduated in 1987. He holds a Bachelor of Arts in Economics from George Washington University.
More Economy in Brief


