 Global| Jan 22 2009
U.S. Weekly Claims For Jobless Insurance Highest Since 1982
by:Tom Moeller
|in:Economy in Brief
Summary
At 589,000 last week, initial claims for unemployment insurance rose another 62,000 to their highest level since late during the sharp recession of 1981-82. During that recession, real GDP fell by 2.9% peak-to-trough. The latest [...]
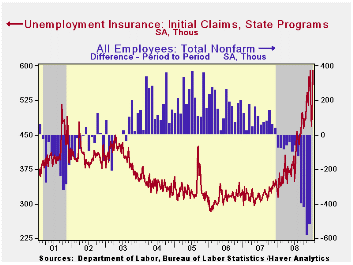
At 589,000 last week, initial claims for unemployment insurance rose another 62,000 to their highest level since late during the sharp recession of 1981-82. During that recession, real GDP fell by 2.9% peak-to-trough. The latest increase in initial claims followed a 57,000 increase during the prior period and it exceeded Consensus expectations for a rise to 548,000.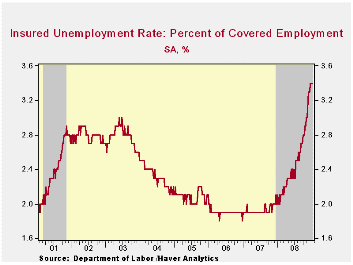
The latest initial claims figure is for the January survey period for nonfarm payrolls and claims were up 5.9% from the December period. During the last ten years there has been a negative 84% correlation between the level of claims and the month-to-month change in nonfarm payrolls.
The Labor Department indicated that the largest increases in initial claims for the week ending January 10 were in Michigan (+34,639), California (+22,573), Florida (+20,658), North Carolina (+15,637), and Pennsylvania (+13,848), while the largest decreases were in South Carolina (-2,682), Massachusetts (-1,882), New York (-1,852), Iowa (-1,593), and Oregon (-856).
Continuing claims for unemployment insurance during the week of January 10 recovered nearly all of the prior week's decline with a 97,000 increase. That also lifted continuing claims to their highest since late 1982. The four-week average of continuing claims rose 58,800 to 4,559,750. Continuing claims provide some indication of workers' ability to find employment and they lag the initial claims figures by one week.
The insured rate of unemployment remained stable for the fourth week at this cycle's high of 3.4%, the highest since 1983. The highest insured unemployment rates in the week ending January 3 were in Michigan (7.5 percent), Oregon (7.5), Idaho (6.7), Wisconsin (6.7), Pennsylvania (6.6), Indiana (5.7), Kentucky (5.7), North Carolina (5.7), South Carolina (5.6), and Rhode Island (5.5).
The Tech Pulse Index: Recent Trends in Tech-Sector Activity from the Federal Reserve Bank of San Francisco is available here.
| Unemployment Insurance (000s) | 01/17/09 | 01/10/09 | 01/03/09 | Y/Y | 2008 | 2007 | 2006 |
|---|---|---|---|---|---|---|---|
| Initial Claims | 589 | 527 | 470 | 81.8% | 420 | 321 | 313 |
| Continuing Claims | -- | 4,607 | 4,510 | 71.8% | 3,342 | 2,552 | 2,459 |

Tom Moeller
AuthorMore in Author Profile »Prior to joining Haver Analytics in 2000, Mr. Moeller worked as the Economist at Chancellor Capital Management from 1985 to 1999. There, he developed comprehensive economic forecasts and interpreted economic data for equity and fixed income portfolio managers. Also at Chancellor, Mr. Moeller worked as an equity analyst and was responsible for researching and rating companies in the economically sensitive automobile and housing industries for investment in Chancellor’s equity portfolio. Prior to joining Chancellor, Mr. Moeller was an Economist at Citibank from 1979 to 1984. He also analyzed pricing behavior in the metals industry for the Council on Wage and Price Stability in Washington, D.C. In 1999, Mr. Moeller received the award for most accurate forecast from the Forecasters' Club of New York. From 1990 to 1992 he was President of the New York Association for Business Economists. Mr. Moeller earned an M.B.A. in Finance from Fordham University, where he graduated in 1987. He holds a Bachelor of Arts in Economics from George Washington University.
More Economy in Brief


