 Global| Dec 04 2008
U.S. Weekly Claims For Jobless Insurance Fell, But Month's Level Still High
by:Tom Moeller
|in:Economy in Brief
Summary
For the second consecutive week, initial claims for unemployment insurance fell. Nevertheless, claims remained near their highest level since the last recession. The 21,000 drop to 509,000 followed a little-revised 13,000 decline [...]
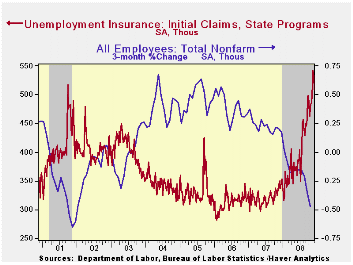
For the second consecutive week, initial claims for unemployment insurance fell. Nevertheless, claims remained near their highest level since the last recession. The 21,000 drop to 509,000 followed a little-revised 13,000 decline during the prior week. Still, claims for all of last month rose 9.8% from the October average.
Expectations had been for claims last week of 535,000. The
four-week moving average of initial claims rose to this cycle's high of
524,500 (54.3% y/y).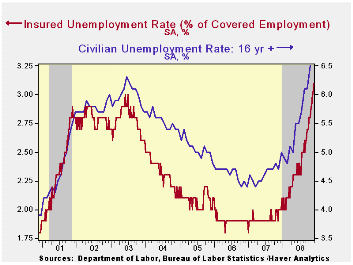
The largest increases in initial claims for the week ending November 22 were in California (+10,882), Ohio (+6,658), Michigan (+6,611), Indiana (+6,501), and Missouri (+5,820), while the largest decreases were in Nebraska (-72), Utah (-37), the Virgin Islands (-8), and North Dakota (-4).
Continuing claims for unemployment insurance during the week of November 22 rose 89,000 after the prior week's revised 18,000 decline. The four-week average of continuing claims rose to a new cycle high of 4,001,750, the highest since 1982. Continuing claims provide some indication of workers' ability to find employment and they lag the initial claims figures by one week.
The insured rate of unemployment rose to a new cycle high of 3.1%. The Commerce Department indicated the highest insured unemployment rates in the week ending November 15 were in Puerto Rico (5.2 percent), Oregon (4.5), Michigan (4.0), Nevada (4.0), Alaska (3.9), California (3.8), Pennsylvania (3.8), Idaho (3.7), New Jersey (3.7), and South Carolina (3.6).
The latest Beige Book from the Federal Reserve covering regional economic conditions can be found here.
The Community Reinvestment Act and the Recent Mortgage Crisis is yesterday's speech by Fed GovernorRandall S. Kroszner it is available here.
| Unemployment Insurance (000s) | 11/29/08 | 11/22/08 | 11/15/08 | Y/Y | 2007 | 2006 | 2005 |
|---|---|---|---|---|---|---|---|
| Initial Claims | 509 | 530 | 543 | 49.7% | 322 | 313 | 331 |
| Continuing Claims | -- | 4,087 | 3,998 | 56.5% | 2,552 | 2,459 | 2,662 |
by Tom Moeller December 4, 2008
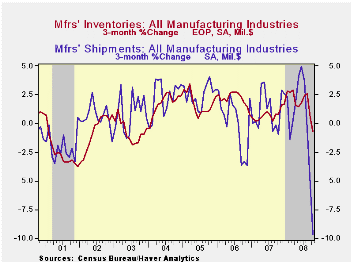
Factory inventories dropped again in October. The 0.6% m/m decline followed a 0.8% slide during the month prior. They were the first back-to-back monthly declines since 2003. Inventories in the transportation sector have been rising as production cutbacks have not kept pace with lower demand. Less the transportation sector, inventories fell 1.0% after a 0.9% September decline.
Inventories of transportation equipment rose 1.6% (15.1% y/y) due to the 1.8% backup in automobile inventories (0.7% y/y) which followed a 2.6% September jump. Light truck inventories also rose 1.6% but they were off by nearly one quarter from last October. Growth in inventories of commercial aircraft continued to dominate the figures, however, and they rose 2.8% during October and they're up by more than one-third y/y. Electrical equipment & appliance inventories fell 0.7% and reversed a like increase during September (+5.1% y/y) while machinery inventories rose a firm 0.2% (5.5% y/y).
Total factory orders fell 5.1% during October which was larger than Consensus expectations for a 3.9% drop. The decline reflected a 6.9% plummet in durable goods orders which was a slightly steeper decline than indicated in the advance report. Orders were pulled lower by an 11.2% decline in new orders for transportation equipment.
Factory shipments dropped 3.2%, about the same as reported for September. Shipments of transportation equipment fell 5.2% as commercial aircraft shipments plunged 10.1% (-22.1% y/y). Shipments of electrical equipment also were weak and they posted a 4.6% (-1.2% y/y) decline. Electronic computer shipments fell for the third straight month (-1.8% y/y) and shipments of furniture & related products fell an even harder 4.1% (-11.3% y/y). Shipments from petroleum refineries were quite weak last month (-13.0%) as oil prices fell and they are off 4.1% y/y.
| Factory Survey (NAICS, %) | October | September | Y/Y | 2007 | 2006 | 2005 |
|---|---|---|---|---|---|---|
| Inventories | -0.6 | -0.8 | 6.2 | 3.7 | 6.4 | 8.9 |
| Excluding Transportation | -1.0 | -0.9 | 4.6 | 2.7 | 7.9 | 8.1 |
| New Orders | -5.1 | -3.1 | -5.3 | 1.9 | 6.2 | 11.9 |
| Excluding Transportation | -4.2 | -4.3 | -2.5 | 1.2 | 7.4 | 11.7 |
| Shipments | -3.2 | -3.1 | -2.3 | 1.2 | 5.9 | 10.4 |
| Excluding Transportation | -2.9 | -3.8 | -0.3 | 1.5 | 6.7 | 11.4 |
| Unfilled Orders | -0.6 | 0.2 | 10.0 | 17.1 | 15.3 | 15.4 |
| Excluding Transportation | -1.6 | -0.6 | 5.2 | 8.2 | 16.0 | 9.2 |
by Tom Moeller December 4, 2008
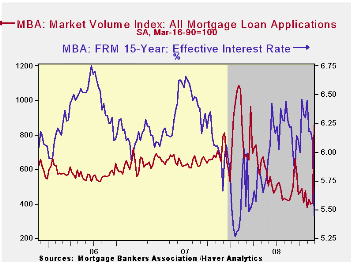
According to the Mortgage Bankers Association, the total number of mortgage applications more than doubled last week as borrowers rushed to take advantage of lower interest rates and when the Fed announced that it would buy GSE debt and MBS.
The index of applications to refinance a home mortgage tripled w/w due to the government's guarantee.
The effective interest rate on a conventional 15-year mortgage plummeted last week to 5.45%, down nearly a full percentage point from the October average. For a 30-year mortgage rates also fell sharply to 5.70%. Interest rates on 15 and 30 year mortgages are closely correlated (>90%) with the rate on 10-year Treasury securities. For an adjustable rate 1-Year mortgage the rate dropped less to 6.74% after having averaged 6.89% during October.
Applications for a mortgage to purchase a home also surged by nearly one half due to lower rates.
During the last ten years there has been a (negative) 79% correlation between the level of applications for purchase and the effective interest rate on a 30-year mortgage. Moreover, during the last ten years there has been a 61% correlation between the y/y change in purchase applications and the change in new plus existing single family home sales.
The Mortgage Bankers Association surveys between 20 to 35 of the top lenders in the U.S. housing industry to derive its refinance, purchase and market indexes. The weekly survey covers roughly 50% of all U.S. residential mortgage applications processed each week by mortgage banks, commercial banks and thrifts. Visit the Mortgage Bankers Association site here.
The figures for weekly mortgage applications are available in Haver's SURVEYW database.
Today's speech titled Housing, Mortgage Markets, and Foreclosures given by Fed Chairman Ben S. Bernanke can be found here.
| MBA Mortgage Applications (3/16/90=100) | 11/28/08 | 11/21/08 | Y/Y | 2007 | 2006 | 2005 |
|---|---|---|---|---|---|---|
| Total Market Index | 857.7 | 404.4 | 8.3% | 652.6 | 584.2 | 708.6 |
| Purchase | 361.1 | 261.6 | -22.2% | 424.9 | 406.9 | 470.9 |
| Refinancing | 3,802.8 | 1,254.0 | 37.7% | 1,997.9 | 1,634.0 | 2,092.3 |
by Robert Brusca December 4, 2008
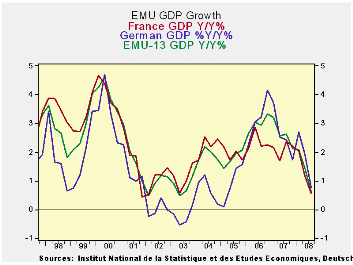
The details of EMU GDP show that the downfall to growth in the
e-zone has been trade. GDP is falling at a 0.8% annual rate in Q3 as
the trade gap widened by €10bln in Q3. Moreover, indicators for Q4 are
still pointing to further weakening. Private consumption is erratic but
the Yr/Yr growth rates show it has slowed to a standstill. Public
consumption continues to grow at a nearly 2.5% pace. Spending on
capital formation has steadily decelerated and now runs at a Yr/Yr pace
of less than 1%, just like GDP. Export and import growth both have
moderated. But import growth is a bit faster than export growth,
spurting in Q3, leading to an expansion in the trade deficit and a
reduction in GDP growth.
The problem that confronts EMU is that domestic demand is
faltering with its Yr/Yr rate of growth at 0.6% compared to 2.1% at the
end of 2007. At the same time international sources of growth are
tailing as exports are up at a 2.4% pace Yr/Yr compared to a five year
average rate of growth of 5.9%. EMU is being pinched between weak
domestic and weak foreign demand. The ECB, Bank of England and Bank of
Sweden rate cuts will help to stimulate Europe in general. But the
global slowdown is in gear and it will run its course. The ECB rate
cuts and the slightly weaker Euro will help to cushion the blow. But
both interest rates and foreign exchange rates take some time to have
an impact. Moreover, with world demand low, no country is going to do
very well with its export growth regardless of currency levels.
| Consumption | Capital | Trade Domestic | ||||||
| GDP | Private | Public | Formation | X-M:lbns E | Exports | Imports | Demand | |
| % change Q/Q (saar) ; X-M is Q/Q change in Blns of euros | ||||||||
| Q3-08 | -0.8% | 0.2% | 3.4% | 2.3% | -10.9 | 1.5% | 6.8% | 1.3% |
| Q2-08 | -0.7% | -0.8% | 3.2% | -6.0% | 2.5 | -0.4% | -1.6% | -1.2% |
| Q1-08 | 2.7% | -0.1% | 1.3% | 9.9% | 2.0 | 7.1% | 6.4% | 2.4% |
| Q4-07 | 1.3% | 0.7% | 1.3% | -2.4% | 6.4 | 1.7% | -1.2% | 0.1% |
| % change Yr/Yr; X-M is Yr/Yr change in Gap in Blns of euros | ||||||||
| Q3-08 | 0.6% | 0.0% | 2.3% | 0.8% | 0.0 | 2.4% | 2.5% | 0.6% |
| Q2-08 | 1.4% | 0.4% | 2.0% | 2.0% | 8.2 | 3.9% | 3.0% | 1.0% |
| Q1-08 | 2.1% | 1.2% | 1.4% | 2.9% | 9.6 | 5.3% | 4.3% | 1.6% |
| Q4-07 | 2.1% | 1.2% | 2.1% | 4.2% | 2.1 | 3.9% | 3.8% | 2.1% |
| 5-Yrs | 2.0% | 1.4% | 1.9% | 3.9% | 1.8 | 5.9% | 6.0% | 2.0% |

Tom Moeller
AuthorMore in Author Profile »Prior to joining Haver Analytics in 2000, Mr. Moeller worked as the Economist at Chancellor Capital Management from 1985 to 1999. There, he developed comprehensive economic forecasts and interpreted economic data for equity and fixed income portfolio managers. Also at Chancellor, Mr. Moeller worked as an equity analyst and was responsible for researching and rating companies in the economically sensitive automobile and housing industries for investment in Chancellor’s equity portfolio. Prior to joining Chancellor, Mr. Moeller was an Economist at Citibank from 1979 to 1984. He also analyzed pricing behavior in the metals industry for the Council on Wage and Price Stability in Washington, D.C. In 1999, Mr. Moeller received the award for most accurate forecast from the Forecasters' Club of New York. From 1990 to 1992 he was President of the New York Association for Business Economists. Mr. Moeller earned an M.B.A. in Finance from Fordham University, where he graduated in 1987. He holds a Bachelor of Arts in Economics from George Washington University.
More Economy in Brief


