 Global| May 04 2010
U.S. Vehicle Sales Slip From High
by:Tom Moeller
|in:Economy in Brief
Summary
Forward momentum behind U.S. unit sales of light vehicles eased during April and sales fell 4.8% to 11.21M units (SAAR) from 11.78M in March. Nevertheless, sales remained up by nearly one-quarter from the recession low. April sales [...]
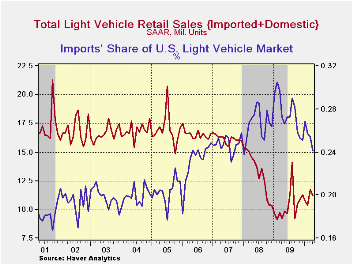
Forward momentum behind U.S. unit sales of light vehicles eased during April and sales fell 4.8% to 11.21M units (SAAR) from 11.78M in March. Nevertheless, sales remained up by nearly one-quarter from the recession low. April sales fell slightly short of Consensus expectations for 11.4M. (Seasonal adjustment of these figures is provided by the U.S. Bureau of Economic Analysis).
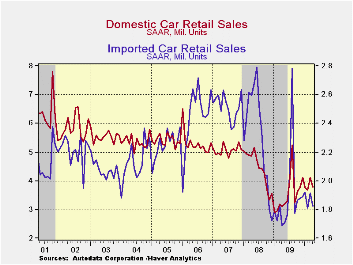
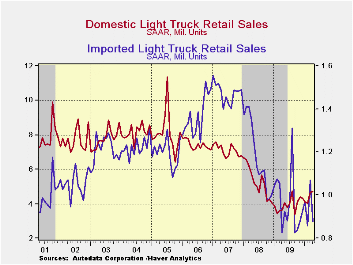
Sales of domestically produced vehicles fell 3.2% last month to 8.50M but gave back just a piece of the 14.0% March gain. Sales of fuel efficient cars fell 8.3% to 3.78M (+22.6% y/y) after the 11.8% March increase. Light truck sales went the other way and rose 1.2% to 4.72M (30.0% y/y). Imported light vehicle sales also fell 9.5% to 2.70M and gave back most of the March rise. Sales of imported autos fell 4.8% to 1.83M after the 5.9% March increase while light truck sales fell 18.0% to 0.88M (+6.5% y/y).
Overall, import's share of the U.S. light vehicle market fell during April to 24.1% its lowest since early 2008. The share has been declining erratically from its high of 30.5% in February '09 and from 27.6% during all of last year. (Imported vehicles are those produced outside the United States.) Imports' share of the U.S. car market rose m/m to 32.6% but remained below 34.8% during 2009. Imports' share of the light truck market also fell to 15.7% but remained below the 19.6% last year.
The U.S. vehicle sales figures can be found in Haver's USECON database.
| Light Vehicle Sales (SAAR, Mil. Units) | April | March | February | April y/y | 2009 | 2008 | 2007 |
|---|---|---|---|---|---|---|---|
| Total | 11.21 | 11.78 | 10.38 | 21.4% | 10.37 | 13.22 | 16.16 |
| Autos | 5.61 | 6.04 | 5.49 | 17.5 | 5.46 | 6.76 | 7.58 |
| Domestic | 3.78 | 4.12 | 3.68 | 22.6 | 3.56 | 4.44 | 5.06 |
| Imported | 1.83 | 1.92 | 1.81 | 8.1 | 1.90 | 2.32 | 2.52 |
| Light Trucks | 5.60 | 5.74 | 4.88 | 25.7 | 4.91 | 6.46 | 8.60 |
| Domestic | 4.72 | 4.67 | 4.03 | 30.0 | 3.95 | 5.28 | 7.10 |
| Imported0 | 0.88 | 1.07 | 0.86 | 6.5 | 0.96 | 1.18 | 1.47 |
by Tom Moeller May 4, 2010
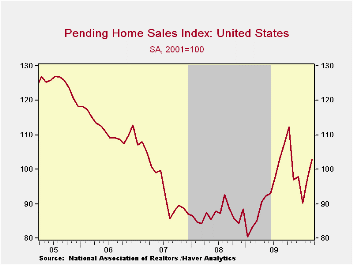
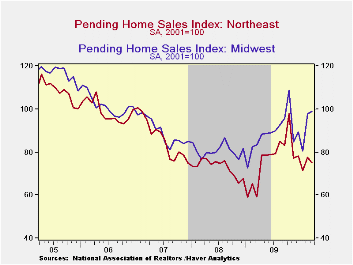
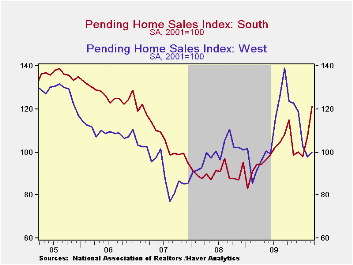
Following the recovery already reported for existing home sales, the National Association of Realtors (NAR) today indicated that March pending sales of existing single-family homes rose 5.3% from February. The gain left home sales up more than one-quarter from the low in January of last year. The latest slightly beat Consensus expectations for a 4.0% increase.
The m/m performance of home sales varied across the country. A large monthly increase in the South (28.4% y/y) was accompanied by small increases in the Midwest (18.4% y/y) and in the West (8.8% y/y). Sales in the Northeast fell moderately (+27.3% y/y)
Pending home sales figures are analogous to the new home sales data from the Commerce Department in that they measure existing home sales when the sales contract is signed, not at the time the sale is closed. The series dates back to 2001 and the data is available in Haver's PREALTOR database.
The latest Senior Loan Officer Opinion Survey on Bank Lending Practices from the Federal Reserve can be found here.
| Pending Home Sales (2001=100) | March | February | January | y/y | 2009 | 2008 | 2007 |
|---|---|---|---|---|---|---|---|
| Total | 102.9 | 97.6 | 90.2 | 21.1% | 95.1 | 86.9 | 95.9 |
| Northeast | 75.1 | 77.7 | 71.3 | 27.3 | 76.7 | 73.0 | 86.1 |
| Midwest | 98.9 | 97.7 | 80.4 | 18.4 | 88.8 | 80.7 | 89.6 |
| South | 121.2 | 107.5 | 98.0 | 28.4 | 98.9 | 90.3 | 107.4 |
| West | 99.9 | 98.0 | 102.9 | 8.8 | 109.9 | 99.2 | 92.1 |
by Tom Moeller May 4,2010
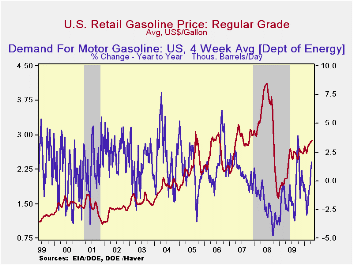
Each week it's the same story. The cost of regular gasoline reached another high. Last week the price for a gallon rose to $2.90, up more than three-quarters since December of 2008. Yesterday, the rise in the spot market price for a gallon of regular gasoline took a breather and fell eight percent from last week's high. The figures are reported by the U.S. Department of Energy and can be found in Haver's WEEKLY & DAILY databases.
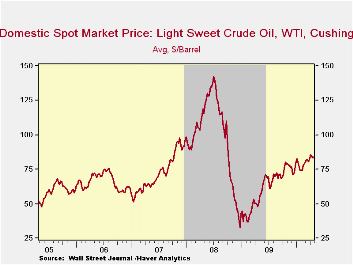
Higher crude oil costs continue behind the rise in gasoline prices. For all of April, the price for a barrel of light sweet crude (WTI) averaged $84.23 versus $81.01 in March. That's up from the December 2008 low of $32.37. Yesterday, the spot price rose further to $86.19.
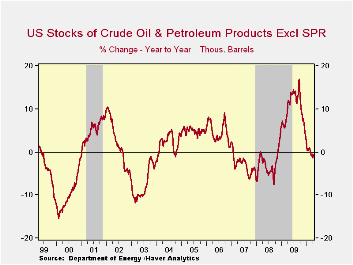
Improved demand for gasoline has been part of the story driving prices higher. Demand for gasoline rose 1.6% last week versus one year ago but that compares with a 3.0% decline in early-February. The demand for residual fuel oil rose an easier 5.8% and distillate demand fell 3.0% y/y. That's improved, however, from a 12.3% decline during February. Inventories of crude oil and petroleum products improved through April but still were down slightly from one year ago.
U.S. natural gas prices continued to slide last week to an average $4.03 per mmbtu (+2.6% y/y). Prices reached a high of $6.50 early in January. Nevertheless, prices remained nearly double the September low.
The energy price data can be found in Haver's WEEKLY database while the daily figures are in DAILY. The gasoline demand figures are in OILWKLY.
| Weekly Prices | 05/03/10 | 04/25/10 | 04/18/10 | Y/Y | 2009 | 2008 | 2007 |
|---|---|---|---|---|---|---|---|
| Retail Regular Gasoline ($ per Gallon, Regular) | 2.90 | 2.85 | 2.86 | 39.5% | 2.35 | 3.25 | 2.80 |
| Light Sweet Crude Oil, WTI ($ per bbl.) | 84.24 | 83.04 | 84.60 | 65.0% | 61.39 | 100.16 | 72.25 |
| Natural Gas Price ($/mmbtu) | 4.13 | 3.99 | 4.09 | 25.4% | 3.95 | 8.88 | 6.97 |
by Louise Curley May 4, 2010
The Brazilian economy continued strong in the first quarter of this year. Industrial production in March, published today, was up 2.75% from February and 18.56% from March 2009. Between February and March production of intermediate goods was up 1.25%, consumer goods, 2.26 and capital goods 2.47%. The year to year increases were, respectively, 17.64%, 13.32% and 35.80%. The levels of the production of intermediate, consumer and capital goods, are shown in the first chart.
In response to the strength of the economy and signs of rising price pressures, COPOM, the Monetary Policy Committee of the Bank of Brazil raised its target rate 75 basis points from 8.75% to 9.50% last week. The second chart shows the target rate since 2000. While not exactly low, by comparison with interest rates in the developed nations, the current level of interest rates in Brazil is a tribute to the long and relatively successful effort to control the country's bouts with hyperinflation.
In addition to the current data on the economy of Brazil in the data base EMERGELA, forecasts of selected features of the economy are available in the Haver data bases, FX4CASTS and OEFMAJOR. The former contains five year forecasts of exchange rates, interest rates, real growth rates, inflation rates and the current account as a percent of GDP. The latter contains ten year forecasts of many of the usual items found in the EMERGELA data base under the headings: Financial, National Income, Prices, Production, Unemployment, International Trade and Balance of Payments and Population/Demographics. The third chart shows the ten year annual forecast of industrial production from the OEFMAJOR data base and the actual 2OO9 industrial production from EMEREGLA.
| Brazil | Mar 10 | Feb 10 | Mar 09 | M/M Chg | Y/Y Chg | 2009 | 2008 | 2007 |
|---|---|---|---|---|---|---|---|---|
| Industrial Production (2002=100) | 130.65 | 127.15 | 110.27 | 2.75 | 18.36 | 116.21 | 125.31 | 121.78 |
| Capital Goods | 181.32 | 176.09 | 133.52 | 2.97 | 35.80 | 150.50 | 182.32 | 159.49 |
| Consumer Goods | 130.39 | 127.51 | 115.06 | 2.26 | 13.32 | 118.68 | 121.89 | 119.73 |
| Intermediate Goods | 122.10 | 120.68 | 103.84 | 1.25 | 17.64 | 109.65 | 119.87 | 118.34 |
by Robert Brusca May 04, 2010
Pressure on the Euro-Area PPI remained in force in March as the price index continues to show Yr/Yr drops. Still the 6-month index is up at a 0.4% rate and the 3-Mo index is up at a 4.1% pace. For manufacturing the same trends are in play but with accelerated rates of growth.
Excluding energy prices both France and Germany show manufactured prices that are transitioning to positive growth rates for prices over three months or longer. Both series show a gradual acceleration in prices. Headline prices accelerate for all large EMU/EU countries in the table. Only Germany is still showing price drops even over three months for headline prices (excluding construction).
Sector prices also how an acceleration (or reduced deceleration, if you prefer) is in motion. These trends are also consistent with the notion that aggregate demand is picking up since at some point very weak prices indicate not just pricing and cost trends but demand deficiencies. That part of the weak price picture appears to be going away. And that is consistent with the better growth metrics we have been seeing in the Zone recently.
| Euro-Area and UK PPI Trends | ||||||
|---|---|---|---|---|---|---|
| M/M | Saar | |||||
| Euro-Area | Mar-10 | Feb-10 | 3-Mo | 6-MO | Yr/Yr | Y/Y Yr Ago |
| TotalxConstruct | 0.3% | -0.1% | 4.1% | 0.4% | -6.6% | 6.1% |
| Capital Gds | 0.0% | 0.0% | -0.1% | -0.8% | -0.7% | 2.8% |
| Consurmer Gds | -0.3% | -0.1% | -1.1% | -0.8% | -2.8% | 2.8% |
| Intermediate&Cap Gds | -0.1% | 0.5% | 3.3% | 0.5% | -6.5% | 4.1% |
| MFG | 0.3% | 0.0% | 5.2% | 2.4% | -5.2% | 3.6% |
| Germany | 0.2% | -0.2% | -5.2% | -6.1% | -7.5% | 7.8% |
| Gy ExEnergy | 0.2% | 0.4% | 3.1% | 1.5% | 0.3% | -1.4% |
| France:Tot | 1.0% | -0.2% | 6.5% | 2.7% | -6.6% | 4.9% |
| Fr ExF&Energy | 0.3% | 0.0% | 1.5% | -0.4% | -3.4% | 3.3% |
| Italy | 0.3% | 0.3% | 5.9% | 1.2% | -6.1% | 4.7% |
| UK | 1.4% | 0.4% | 19.0% | 8.6% | -2.7% | 14.6% |
| Euro-Area Harmonized PPI ex construction | ||||||

Tom Moeller
AuthorMore in Author Profile »Prior to joining Haver Analytics in 2000, Mr. Moeller worked as the Economist at Chancellor Capital Management from 1985 to 1999. There, he developed comprehensive economic forecasts and interpreted economic data for equity and fixed income portfolio managers. Also at Chancellor, Mr. Moeller worked as an equity analyst and was responsible for researching and rating companies in the economically sensitive automobile and housing industries for investment in Chancellor’s equity portfolio. Prior to joining Chancellor, Mr. Moeller was an Economist at Citibank from 1979 to 1984. He also analyzed pricing behavior in the metals industry for the Council on Wage and Price Stability in Washington, D.C. In 1999, Mr. Moeller received the award for most accurate forecast from the Forecasters' Club of New York. From 1990 to 1992 he was President of the New York Association for Business Economists. Mr. Moeller earned an M.B.A. in Finance from Fordham University, where he graduated in 1987. He holds a Bachelor of Arts in Economics from George Washington University.
More Economy in Brief


