 Global| Jan 04 2007
U.S. Vehicle Sales Rose in December
by:Tom Moeller
|in:Economy in Brief
Summary
In December, U.S. sales of light vehicles rose 4.4% from the prior month to 16.75M units, according to the Autodata Corporation. The rise was to the highest level since July. For the full year of 2006, however, vehicle sales fell 2.4% [...]
In December, U.S. sales of light vehicles rose 4.4% from the prior month to 16.75M units, according to the Autodata Corporation. The rise was to the highest level since July.
For the full year of 2006, however, vehicle sales fell 2.4% to 16.55M, the lowest level since 1998.
Improved domestic car sales lifted December vehicle sales with an 11.4% (3.8% y/y) gain but for the year domestic auto sales fell 1.4% versus 2005. Sales of imported autos also were strong last month and posted a 6.1% (8.5% y/y) gain and for the year rose 8.7%.
Imported light truck sales also rose 1.9% (19.0% y/y) last month to 1.51M units and for 2006 rose 14.4%.
Domestic light truck sales slipped for the third consecutive month. The 0.5% decline to 7.14M units (-12.4% y/y) still, however, garnered 84% of the U.S. market for light trucks during 2006.
The Minutes to the latest FOMC meeting can be found here.
| Light Vehicle Sales (SAAR, Mil. Units) | December | November | Y/Y | 2006 | 2005 | 2004 |
|---|---|---|---|---|---|---|
| Total | 16.75 | 16.04 | -2.1% | 16.55 | 16.96 | 16.87 |
| Autos | 8.09 | 7.38 | 5.3% | 7.77 | 7.65 | 7.49 |
| Trucks | 8.65 | 8.66 | -8.2% | 8.78 | 9.32 | 9.37 |
by Tom Moeller January 4, 2007
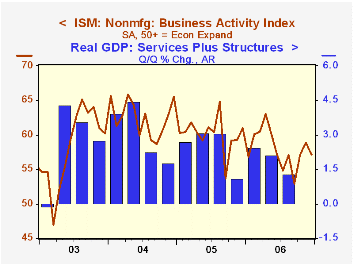
The non-manufacturing sector Business Activity Index fell as expected to 57.1 last month and reversed all of November's 1.8 point increase. The figure from the Institute for Supply Management (ISM) averaged 57.9 last year versus an average of 60.1 during 2005 but did improve slightly during the fourth quarter from 3Q.
Since the series' inception in 1997 there has been a 50% correlation between the level of the Business Activity Index and the q/q change in real GDP for services plus construction.
The new orders sub-index fell hard during December to 54.4, the lowest level since August. The employment index, however, improved to 53.3, its highest since September. Since the series' inception in 1997 there has been a 60% correlation between the level of the ISM non-manufacturing employment index and the m/m change in payroll employment in the service producing plus the construction industries.
Pricing power improved for the second month and rose to 59.1. Since inception eight years ago, there has been a 70% correlation between the price index and the y/y change in the GDP services chain price index.
ISM surveys more than 370 purchasing managers in more than 62 industries including construction, law firms, hospitals, government and retailers. The non-manufacturing survey dates back to July 1997.Business Activity Index for the non-manufacturing sector reflects a question separate from the subgroups mentioned above. In contrast, the NAPM manufacturing sector composite index is a weighted average five components.
| ISM Nonmanufacturing Survey | December | November | Dec. '05 | 2006 | 2005 | 2004 |
|---|---|---|---|---|---|---|
| Business Activity Index | 57.1 | 58.9 | 61.0 | 57.9 | 60.1 | 62.5 |
| Prices Index | 59.1 | 55.6 | 67.2 | 65.4 | 67.9 | 68.8 |
by Tom Moeller January 4, 2007
Initial unemployment insurance claims popped 10,000 last week to 329,000 for the third consecutive weekly gain. The increase outpaced Consensus expectations for stability at 318,000.
During the last ten years there has been a (negative) 77% correlation between the level of initial claims and the m/m change in nonfarm payroll employment.
The four-week moving average of initial claims also rose to 317,500 (2.3% y/y) though that was down from the early December high of 328,750.
Continuing claims for unemployment insurance dropped a sharp 76,000.
The insured rate of unemployment remained at 1.9% for the seventh consecutive week and equaled the average rate since February.
| Unemployment Insurance (000s) | 12/30/06 | 12/23/06 | Y/Y | 2006 | 2005 | 2004 |
|---|---|---|---|---|---|---|
| Initial Claims | 329 | 319 | 11.5% | 313 | 332 | 343 |
| Continuing Claims | -- | 2,446 | -8.3% | - | 2,662 | 2,924 |
by Tom Moeller January 4, 2007
For December, announced job cuts reported by Challenger, Grey & Christmas fell a sharp 28.8% to 54,643. The three month moving average of layoff announcements also fell to 66,864, its lowest level since August.
During the last ten years there has been an 83% (inverse) correlation between the three month moving average level of announced job cuts and the three month change payroll employment.
Layoffs fell sharply m/m in the automotive (+77.0% y/y) and apparel (+1.4% y/y) and services (-57.0% y/y) industries.
Job cut announcements differ from layoffs. Many are achieved through attrition, early retirement or just never occur.
Challenger also reported that announced hiring plans fell sharply m/m (-84.4% y/y).
| Challenger, Gray & Christmas | December | November | Y/Y | 2006 | 2005 | 2004 |
|---|---|---|---|---|---|---|
| Announced Job Cuts | 54,643 | 76,773 | -49.3% | 839,822 | 1,072,054 | 1,039,935 |

Tom Moeller
AuthorMore in Author Profile »Prior to joining Haver Analytics in 2000, Mr. Moeller worked as the Economist at Chancellor Capital Management from 1985 to 1999. There, he developed comprehensive economic forecasts and interpreted economic data for equity and fixed income portfolio managers. Also at Chancellor, Mr. Moeller worked as an equity analyst and was responsible for researching and rating companies in the economically sensitive automobile and housing industries for investment in Chancellor’s equity portfolio. Prior to joining Chancellor, Mr. Moeller was an Economist at Citibank from 1979 to 1984. He also analyzed pricing behavior in the metals industry for the Council on Wage and Price Stability in Washington, D.C. In 1999, Mr. Moeller received the award for most accurate forecast from the Forecasters' Club of New York. From 1990 to 1992 he was President of the New York Association for Business Economists. Mr. Moeller earned an M.B.A. in Finance from Fordham University, where he graduated in 1987. He holds a Bachelor of Arts in Economics from George Washington University.
More Economy in Brief


