 Global| Jan 05 2006
U.S. Vehicle Sales Recovered at Yearend, Along With Gas Price
by:Tom Moeller
|in:Economy in Brief
Summary
The Autodata Corporation reported that December US sales of light vehicles rose 9.1% to 17.17M units. The gain added to a 6.7% m/m rise in November but the increases were from an October level that was the most depressed since 1998. [...]
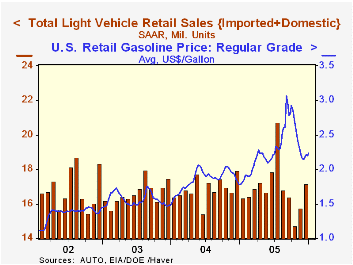
The Autodata Corporation reported that December US sales of light vehicles rose 9.1% to 17.17M units. The gain added to a 6.7% m/m rise in November but the increases were from an October level that was the most depressed since 1998. In addition, the increase left sales below December 2004 and the 2005 average of sales rose just 0.3% y/y and the annual level was down 2.8% from the record set in 2000. Consensus expectations had been for December sales of 16.8M.
Gasoline also moved higher at yearend with the average retail price at $2.24 per gallon (25.9% y/y), up four cents from the prior week and up a dime from the early December low. This week in spot market trading, gasoline is up another fourteen cents from the last week in December. The latest figures on the demand for gasoline indicate full recovery from declines during the Fall.
Gauging the Size of Today's Price Shocks from the Federal Reserve Bank of St. Louis is available here.
Sales of US made cars & trucks rose 9.3% m/m in December (-5.3% y/y) while the 2005 sales average declined 0.2% from 2004 and fell 7.5% from the 2000 peak. Domestic truck sales rose 17.2% (-3.1% y/y) in December and the 2005 average fell 0.9%. Car sales slid 1.1% (-8.6% y/y) though the annual sales average increased 0.9%.
Sales of imported cars & trucks increased 8.3% m/m (-0.3% y/y) in December and for the year rose 2.1%. Sales of imported trucks rose a sharp 12.5% (-4.7% y/y) and sales of imported autos rose 6.2% (2.3% y/y).
Import's share of the US light vehicle market slipped m/m in December to 21.0% and for the year increased to a record 20.4% versus 12.9% ten years ago.
| Light Vehicle Sales (SAAR, Mil. Units) | Dec | Nov | Y/Y | 2005 | 2004 | 2003 |
|---|---|---|---|---|---|---|
| Total | 17.17 | 15.74 | -4.3% | 16.92 | 16.87 | 16.63 |
| Autos | 7.64 | 7.56 | 1.7% | 7.65 | 7.49 | 7.62 |
| Trucks | 9.53 | 8.18 | -3.3% | 9.27 | 9.37 | 9.01 |
by Tom Moeller January 5, 2006
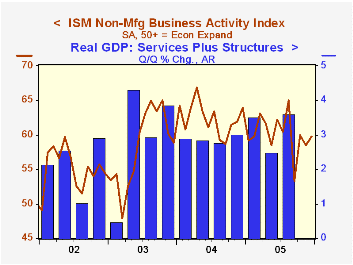
The Business Activity Index for the non-manufacturing sector recovered in December about all that it lost in November. The 1.3 point gain to 59.8 followed an unrevised 1.5 point slip in November. A reading above 50 indicates expansion. The latest reading was firmer than Consensus expectations for a rise to 59.0.
Since the series' inception in 1997 there has been a 53% correlation between the Business Activity Index and the q/q change in real GDP for services plus construction.
The new orders component rose for the third straight month and the employment index added marginally to a 4 point November rise to the highest level since August. Since the series' inception in 1997 there has been a 60% correlation between the level of the ISM non-manufacturing employment index and the m/m change in payroll employment in the service producing plus the construction industries.
Pricing power fell for the third month to the lowest level since August. Since inception eight years ago, there has been a 70% correlation between the price index and the y/y change in the GDP Services chain price index.
ISM surveys more than 370 purchasing managers in more than 62 industries including construction, law firms, hospitals, government and retailers. The non-manufacturing survey dates only to July 1997, therefore its seasonal adjustment should be viewed tentatively.Business Activity Index for the non-manufacturing sector reflects a question separate from the subgroups mentioned above. In contrast, the NAPM manufacturing sector composite index is a weighted average five components.
| ISM Nonmanufacturing Survey | Dec | Nov | Dec '04 | 2005 | 2004 | 2003 |
|---|---|---|---|---|---|---|
| Business Activity Index | 59.8 | 58.5 | 63.9 | 60.1 | 62.4 | 58.2 |
| Prices Index | 69.5 | 74.2 | 73.6 | 68.2 | 69.0 | 56.8 |
by Tom Moeller January 5, 2006
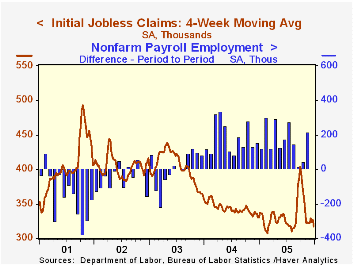
Initial claims for unemployment insurance fell a sharp 35,000 to 291,000 in the last week of 2005 following an upwardly revised 7,000 increase the prior period. The latest level was the lowest since September 2000. Consensus expectations had been for 320,000 claims.
During the last ten years there has been a (negative) 75% correlation between the level of initial jobless insurance claims and the m/m change in payroll employment.
The four-week moving average of initial claims fell sharply to 316,750 (-4.0% y/y), the lowest level since August.
Continuing unemployment insurance claims increased 13,000 following the downwardly revised 75,000 spike during the prior week.
The insured rate of unemployment remained at 2.1% for the third week.
| Unemployment Insurance (000s) | 12/31/05 | 12/24/05 | Y/Y | 2005 | 2004 | 2003 |
|---|---|---|---|---|---|---|
| Initial Claims | 291 | 326 | -15.9% | 331 | 343 | 402 |
| Continuing Claims | -- | 2,718 | -3.3% | 2,926 | 3,531 |
by Tom Moeller January 5, 2006
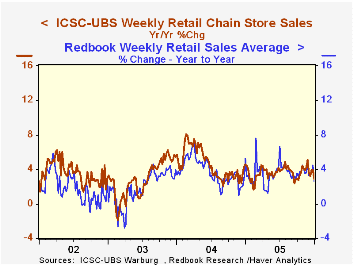
Chain store sales dipped 0.8% during the final week of 2005 according to the International Council of Shopping Centers (ICSC)-UBS survey. The decline, however, followed three weeks of solid increase. Therefore, December sales on average gained 0.4%, double the November increase.
During the last ten years there has been a 51% correlation between the y/y change in chain store sales and the change in non-auto retail sales less gasoline, as published by the US Census Department. Chain store sales correspond directly with roughly 14% of non-auto retail sales less gasoline.
The leading indicator of chain store sales slipped 0.1% in the latest week and the December average was unchanged from November. The ICSC-UBS retail chain-store sales index is constructed using the same-store sales (stores open for one year) reported by 78 stores of seven retailers: Dayton Hudson, Federated, Kmart, May, J.C. Penney, Sears and Wal-Mart.The Redbook Research survey of chain store sales painted a weaker picture of yearend selling. In fact, weakness throughout the month left the December average of general merchandise sales 0.2% below November.
| ICSC-UBS (SA, 1977=100) | 12/31/05 | 12/24/05 | Y/Y | 2005 | 2004 | 2003 |
|---|---|---|---|---|---|---|
| Total Weekly Chain Store Sales | 464.0 | 467.6 | 2.9% | 3.6% | 4.7% | 2.9% |
by Carol Stone January 5, 2006
Today, January 5, a wide variety of data was reported by national statistical agencies and private sources all over the world. Some of these reports glean considerable press coverage, particularly if the results are a surprise, such as with German manufacturing orders: these orders grew again in November, when market forecasters had expected them to decline.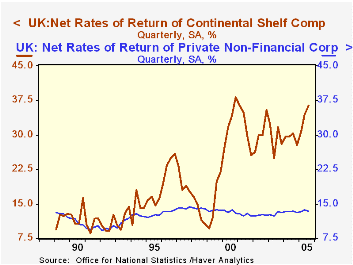
But Haver's databases, of course, carry far more background material on the economies of myriad countries. For instance, yesterday in this space, we highlighted the CPI of Thailand, a major release in a small country. Today we take the opposite approach, describing a secondary release in a major country, to wit, corporate profitability in the UK. The ONS publishes quarterly rates of return for total private non-financial corporations and some subsets of companies. Most prominently, oil companies are highlighted, referred to as "UK continental shelf companies". Separately, manufacturing and service sector groups are shown. A few other miscellaneous sectors, such as construction, are not shown individually.
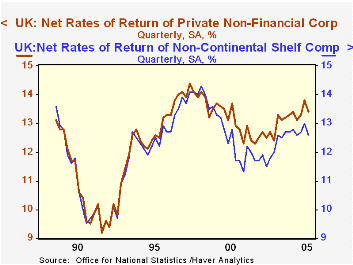
In Q3 2005, all private nonfinancial companies earned a 13.4% net return on their capital. This is down from 13.8% in Q2, but that was a 6-1/2 year high. The average for the last five years is 12.9%. Manufacturing companies earned just 6.2% on assets in Q3, following a somewhat higher 7.9% in Q2. This group has experienced basically flat returns in recent years, averaging about 7% since 2002. Services industries have higher rates of return, averaging 16.3% over the last four years, but these too are trendless, moving back and forth in a saw-tooth pattern.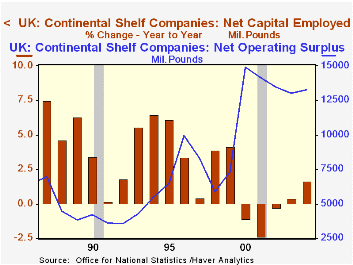
The breakout of the petroleum industry is informative. It shows that back in the early 1990s this sector had about the same magnitude return as the rest of UK industry. However, this relationship has changed markedly, with the "Continental Shelf companies" seeing far higher returns now, 36.3% in Q3. Annual data from ONS give some detail on the operating surpluses and capital that generate the return ratio. They indicate that the recent high rates of return are not, as one might think, due totally to higher oil prices. Specifically, since 2000, the UK oil industry has stopped expanding, as capital employed, shown in the third graph, has flattened. At the same time, sharply higher oil prices are surely responsible for 2005's further escalation of returns into the mid-30% range.
Normally, higher returns might be expected to prompt the renewed expansion of an industry. There are mixed signals about these prospects. Haver's OGJ database and OGJANN from the "Oil and Gas Journal" contain other broad data on the UK petroleum industry. Petroleum reserves in the UK are decreasing, and daily production of crude oil has fallen even into Q3. However, the so-called "rig count" of operating oil rigs shows a sustained upturn over the last six months. With this mixed picture about specific UK potential, perhaps what the high returns mean is more general, and perhaps they will be used for new kinds of energy development, not just the expansion of local output.
| United Kingdom: Private Nonfin Corps: Net Rates of Return (%) |
Q3 2005 | Q2 2005 | Q1 2005 | 2004 | 2003 | 2002 |
|---|---|---|---|---|---|---|
| All PNFCs | 13.4 | 13.8 | 13.3 | 13.3 | 12.9 | 12.5 |
| UK Continental Shelf | 36.3 | 34.4 | 30.6 | 29.3 | 29.2 | 30.4 |
| Non-Continental Shelf | 12.6 | 13.0 | 12.7 | 12.7 | 12.2 | 11.7 |
| Manufacturing | 6.2 | 7.9 | 5.8 | 7.1 | 6.9 | 7.2 |
| Services | 16.6 | 16.5 | 17.3 | 16.3 | 16.5 | 16.1 |

Tom Moeller
AuthorMore in Author Profile »Prior to joining Haver Analytics in 2000, Mr. Moeller worked as the Economist at Chancellor Capital Management from 1985 to 1999. There, he developed comprehensive economic forecasts and interpreted economic data for equity and fixed income portfolio managers. Also at Chancellor, Mr. Moeller worked as an equity analyst and was responsible for researching and rating companies in the economically sensitive automobile and housing industries for investment in Chancellor’s equity portfolio. Prior to joining Chancellor, Mr. Moeller was an Economist at Citibank from 1979 to 1984. He also analyzed pricing behavior in the metals industry for the Council on Wage and Price Stability in Washington, D.C. In 1999, Mr. Moeller received the award for most accurate forecast from the Forecasters' Club of New York. From 1990 to 1992 he was President of the New York Association for Business Economists. Mr. Moeller earned an M.B.A. in Finance from Fordham University, where he graduated in 1987. He holds a Bachelor of Arts in Economics from George Washington University.
More Economy in Brief


