 Global| Dec 04 2006
U.S. Vehicle Sales Lowest in a Year
by:Tom Moeller
|in:Economy in Brief
Summary
U.S. sales of light vehicles in November fell 0.7% from the prior month to 16.04M units, according to the Autodata Corporation. The decline was the third in the last four months and was to the lowest level since the dismal October [...]
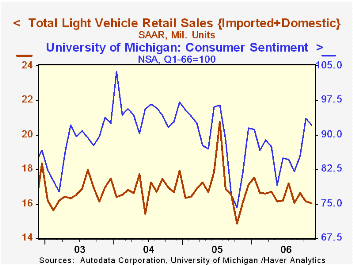
U.S. sales of light vehicles in November fell 0.7% from the prior month to 16.04M units, according to the Autodata Corporation. The decline was the third in the last four months and was to the lowest level since the dismal October 2005 figure which reflected surging gasoline prices and a plunge in consumer sentiment.
So far in 2006 vehicle sales have averaged 16.53M units, down 2.4% from the comparable period during 2005.
Lower sales of light trucks paced last month's decline with a 2.0% (+2.7% y/y) decline, the third in the last four months. The average of light truck sales year to date is down 5.5% versus the first eleven months of last 2005.
Sales of imported light trucks dropped 4.8% (+29.8% y/y) after a 10.7% jump during October. Year to date sales of imported light trucks are 14.0% higher in 2006 than during the first eleven months of 2005.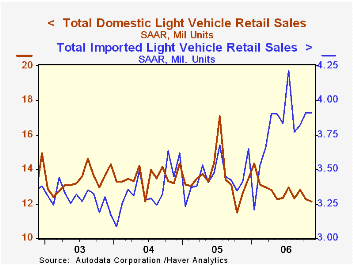
Domestic light truck sales fell a lesser 1.4% (-1.5% y/y) but during the first eleven months of this year domestic light truck sales are 8.3% lower than during the first eleven months of 2005 at an average of 7.44M units. They still, however, garnered 85% of the U.S. market for light trucks.
Domestic car sales fell 0.4% (-7.7% y/y) after October's 4.7% slump. Year to date sales of U.S. nameplates were down 7.7% versus 2005. Sales of imported autos, however, increased 3.4% (7.2% y/y) last month and year to date sales of imported autos were up 8.8%.
U.S. car & truck production, a figure in Haver's USECON database, fell 10.4% (-5.3% y/y) during November. Year to date production was off 5.6% from 2005.
Monetary Policy and Uncertainty is Friday's speech by Fed Vice Chairman Donald L. Kohn and it is available here.
| Light Vehicle Sales (SAAR, Mil. Units) | November | October | Y/Y | 2005 | 2004 | 2003 |
|---|---|---|---|---|---|---|
| Total | 16.04 | 16.16 | -0.1% | 16.96 | 16.87 | 16.63 |
| Autos | 7.38 | 7.32 | -3.2% | 7.65 | 7.49 | 7.62 |
| Trucks | 8.66 | 8.84 | 2.7% | 9.32 | 9.37 | 9.01 |
by Louise Curley December 4, 2006
Thailand's Gross Domestic Product increased in third quarter at an annual rate of 6.0% from the second quarter. The rise was higher than expected and has prompted the government to raise its 2006 growth forecast to close to 5% from its earlier estimate of 4.7%.
In spite of the acceleration of growth during the third quarter, the year over year increases show a slowing trend, largely attributed to the political upheaval caused by dissatisfaction with the government of Prime Minister Thaksin Shinawatra and the subsequent coup by the armed forces on September 19th. The political situation has quieted and the military authorities have promised to hold elections next October.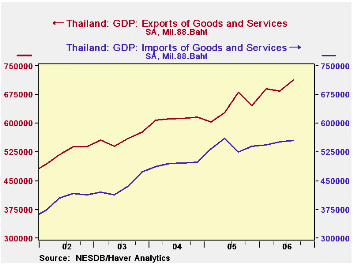
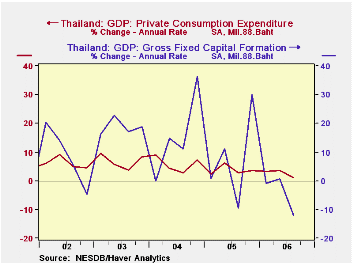
The acceleration of growth in the third quarter was due entirely to a 27.6 billion bhat increase in net exports, the result of a 4.4% increase in exports and a 0.4% increase in imports. The first chart shows exports and imports and the widening gap in recent quarters. Domestic demand declined by 3.4 billion bahts. Increases of 1.7 billion bahts in private consumption and 3.1 billion bahts in inventories were offset by a declines in public consumption of 0.7 billion bahts and fixed investment spending of 7.4 billion bahts. The second chart shows the annual rate of change in private consumption and in fixed investment spending. The annual rate of increase in private consumption dropped from 3.66% in the second quarter to 1.23% in the third quarter. The annual rate of change in fixed investment went from 0.63% in the second quarter to -12.01% in the third quarter..
| THAILAND | 3Q 06 | 2Q 06 | Dif |
|---|---|---|---|
| Gross Domestic Product (Bil. 88 Bahts) | 1,020.1 | 1,005.2 | 14.9 |
| Expenditure on GDP Dollar) | 1,022.0 | 997.9 | 24.2 |
| Domestic Demand | 862.6 | 866.0 | -3.4 |
| Private Consumption | 543.8 | 542.2 | 1.7 |
| Public Consumption | 92.0 | 92.6 | -0.7 |
| Fixed Investment | 228.9 | 236.3 | -7.4 |
| Change in Inventories | -2.1 | -5.1 | 3.1 |
| Net Exports | 159.4 | 131.8 | 27.6 |
| Exports | 713.6 | 683.9 | 29.7 |
| Imports | 554.2 | 552.0 | 2.1 |
| Statistical Discrepancy | -2.0 | 7.4 | -9.3 |

Tom Moeller
AuthorMore in Author Profile »Prior to joining Haver Analytics in 2000, Mr. Moeller worked as the Economist at Chancellor Capital Management from 1985 to 1999. There, he developed comprehensive economic forecasts and interpreted economic data for equity and fixed income portfolio managers. Also at Chancellor, Mr. Moeller worked as an equity analyst and was responsible for researching and rating companies in the economically sensitive automobile and housing industries for investment in Chancellor’s equity portfolio. Prior to joining Chancellor, Mr. Moeller was an Economist at Citibank from 1979 to 1984. He also analyzed pricing behavior in the metals industry for the Council on Wage and Price Stability in Washington, D.C. In 1999, Mr. Moeller received the award for most accurate forecast from the Forecasters' Club of New York. From 1990 to 1992 he was President of the New York Association for Business Economists. Mr. Moeller earned an M.B.A. in Finance from Fordham University, where he graduated in 1987. He holds a Bachelor of Arts in Economics from George Washington University.
More Economy in Brief


