 Global| Mar 04 2008
U.S. Vehicle Sales in FebruaryRemained Low, Gasoline Price Up
by:Tom Moeller
|in:Economy in Brief
Summary
With just a 0.3% m/m uptick, the increase in U.S. sales of light vehicles last month did little to recover a 5.4% January drop. At a 15.38M unit annual selling rate, sales remained quite low. According to the Autodata Corporation [...]
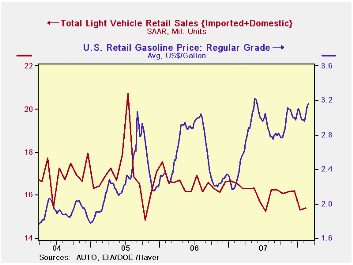
With just a 0.3% m/m uptick, the increase in U.S. sales of
light vehicles last month did little to recover a 5.4% January drop. At
a 15.38M unit annual selling rate, sales remained quite low. According
to the Autodata Corporation sales during the last two months which
averaged 15.35M, were the worst in nearly ten years and the two months
were 5.0% below the 2007 average.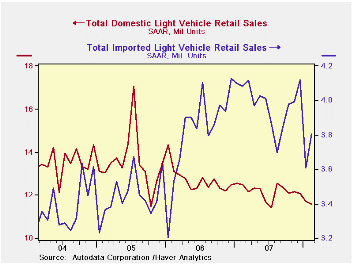
Sales of domestically made light vehicles fell 1.3% last month after a 3.8% m/m decline during January. Sales of U.S. made cars fell 1.7%, the fourth decline in the last five months. Sales of domestically made light trucks slipped 0.9%, the fifth down month in the last six. They're down 11.8% during that period.
Sales of imported light vehicles recovered
5.4% m/m to 3.80M units and made up a little less than half the January
plunge. Sales of imported autos rose 6.9% after January's 14.1% m/m
decline and sales of imported light trucks rose 2.9%. These figures
were from January levels that were revised slightly.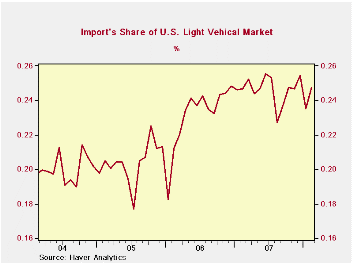
Import's share of the U.S. light vehicle market rose back to 24.7%, near its record monthly levels of last year and an average 24.6% all of 2007. Imported vehicles are those produced outside the U.S. and does not include vehicles with the nameplate of a foreign manufacturer produced within the U.S.
Retail gasoline prices last week moved up another three cents to $3.16 per gallon, according to the US Department of Energy survey.Pushing the price up was an increase in the price for spot WTI crude oil prices to $100.89 per barrel.
Today's speech by Fed Chairman Ben S. Bernanke titled Reducing Preventable Mortgage Foreclosures can be found here.
Liquidity-Risk Management in the Business of Banking is yesterday's speech by Fed Governor Randall S. Kroszner and it is available here.
| Light Vehicle Sales (SAAR, Mil. Units) | February | January | Y/Y | 2007 | 2006 | 2005 |
|---|---|---|---|---|---|---|
| Total | 15.38 | 15.33 | -7.2% | 16.18 | 16.55 | 16.96 |
| Autos | 7.31 | 7.25 | -2.2% | 7.58 | 7.77 | 7.65 |
| Domestic | 4.92 | 5.01 | 0.3% | 5.07 | 5.31 | 5.40 |
| Imported | 2.39 | 2.24 | -7.0% | 2.51 | 2.45 | 2.25 |
| Light Trucks | 8.06 | 8.09 | -11.3% | 8.60 | 8.78 | 9.32 |
| Domestic | 6.65 | 6.72 | -12.2% | 7.12 | 7.42 | 8.12 |
| Imported | 1.41 | 1.37 | -6.6% | 1.48 | 1.37 | 1.20 |
| Weekly Prices | 03/03/08 | 02/25/08 | Y/Y | 2007 | 2006 | 2005 |
|---|---|---|---|---|---|---|
| Retail Gasoline ($ per Gallon) | 3.16 | 3.13 | 26.2% | 2.80 | 2.57 | 2.27 |
| Light Sweet Crude Oil, WTI ($ per bbl.) | -- | 100.89 | 64.1% | 94.00 | 61.11 | 58.16 |
by Tom Moeller March 4, 2008
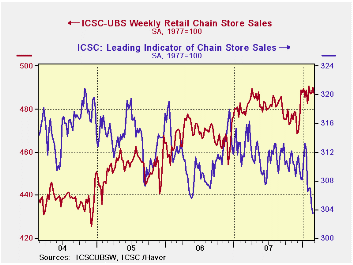
The International Council of Shopping Centers ICSC-UBS Chain Store survey indicated that chain store sales fell 0.6% last week. The decline finished a four week period during which sales moved sideways. However, due to a firm 1.7% rise to open February sales for all of the month rose 0.4% from January following that month's 1.3% surge.
During the last ten years there has been a 45% correlation between the y/y change in chain store sales and the change in nonauto retail sales less gasoline.The ICSC-UBS retail chain-store sales index is constructed using the same-store sales (stores open for one year) reported by 78 stores of seven retailers: Dayton Hudson, Federated, Kmart, May, J.C. Penney, Sears and Wal-Mart.
During the latest week the leading indicator of chain store sales from ICSC-UBS fell 0.3% after a 0.8% decline during the prior period.The index has trended steadily lower since early January.
An Expanded Look at Employment from the Federal Reserve Bank of St. Louis can be found here.
| ICSC-UBS (SA, 1977=100) | 03/01/08 | 02/23/08 | Y/Y | 2007 | 2006 | 2005 |
|---|---|---|---|---|---|---|
| Total Weekly Chain Store Sales | 487.0 | 489.9 | 2.1% | 2.8% | 3.3% | 3.6% |
by Louise Curley March 4, 2008
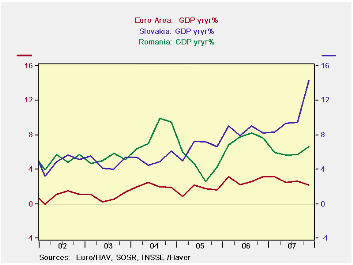
>Contrary to the slowdowns taking place in the United
States and Western Europe both Slovakia and Romania reported increases
in economic activity in the last quarter of 2007. Slovakia reported a
resounding increase of 14.26% and Romania an increase of 6.6%. The year
to year increases in real GDP in Slovakia and Romania are shown in the
first chart along with the year to year increases in GDP in the Euro
Area.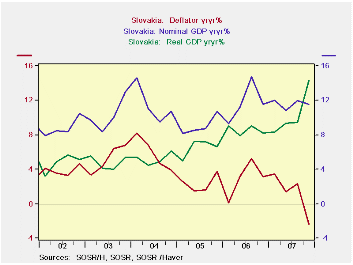
Part of the 14.26% increase Slovakia' GDP in the fourth
quarter was due to a big stockpiling of cigarettes by wholesalers to
avoid the tax increase that took effect on January 1, 2008. However,
even without the one time stockpiling, economic activity in the fourth
is estimated to have risen 9.7%. The accounting for the stockpiling may
also have had some anomalous effects on the deflator. In the fourth
quarter of 2007 the deflator was 2.41% below that of fourth quarter of
2006 indicating deflation. While inflation has been subdued in
Slovakia, there has been no suggestion of deflation. In general the
deflator has been the smaller part of the increase in nominal GDP, with
real GDP providing the larger part. By contrast, inflation has provided
the greater part of the increase in nominal GDP in Romania. The second
and third charts show the changes in the real and nominal GDP and in
the deflator for the two countries.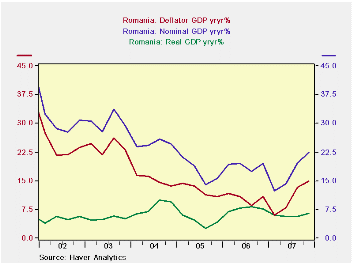
Both Slovakia and Romania are members of the European Union (EU). In dollar terms Romania's GDP was $121.9 billion in 2006 and Slovakia's, $56.3. With a population of 21.6million, almost four times Slovakia's population of 5.4 million, Romania' per capita GDP was $5,651 in 2006, compared to $10,439 for Slovakia.
| Year to Year Changes in Real GDP | Q4 07 | Q3 07 | Q2 07 | Q1 07 |
|---|---|---|---|---|
| Romania | 6.60 | 5.70 | 9.32 | 8.31 |
| Slovakia | 14.26 | 9.41 | 9.32 | 8.31 |
| Euro Area | 2.15 | 2.65 | 3.47 | 3.09 |
| Year to Year Changes | ||||
| Romania: Nominal GDP | 22.49 | 19.74 | 14.19 | 12.32 |
| Real GDP | 6.60 | 5.70 | 5.63 | 5.98 |
| Deflator | 14.90 | 13.38 | 8.10 | 5.99 |
| Slovakia: Nominal GDP | 11.54 | 11.97 | 10.79 | 9.32 |
| Real GDP | 14.26 | 9.41 | 9.32 | 8.31 |
| Deflator | -2.41 | 2.31 | 1.42 | 3.42 |
by Robert Brusca March 4, 2008
| Euro Area and UK PPI Trends | ||||||
|---|---|---|---|---|---|---|
| M/M | SAAR | |||||
| Euro Area 15 | Jan-08 | Dec-07 | 3-Mo | 6-MO | Yr/Yr | Y/Y Yr Ago |
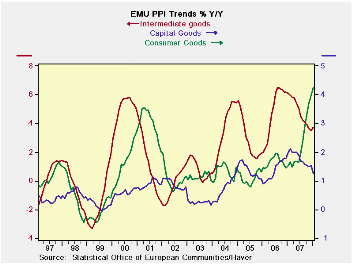
| Total PPI ex Construction | 0.8% | 0.1% | 7.4% | 6.0% | 4.9% | 3.1% |
| Excl Energy | 0.6% | 0.1% | 3.1% | 3.3% | 3.3% | 3.5% |
| Capital Goods | 0.3% | 0.1% | 1.6% | 1.4% | 1.3% | 2.0% |
| Consumer Goods | 0.5% | 0.3% | 4.8% | 5.6% | 4.2% | 1.5% |
| Intermediate & Capital Goods | 0.7% | 0.0% | 2.3% | 2.1% | 2.8% | 4.5% |
| Energy | 1.4% | 0.2% | 21.9% | 15.6% | 10.6% | 1.6% |
| MFG | 0.5% | 0.1% | 5.2% | 4.7% | 5.1% | 2.4% |
| Germany PPI | 0.8% | -0.1% | 6.5% | 4.6% | 3.3% | 3.2% |
| Ex Energy | 0.4% | 0.0% | 1.4% | 2.2% | 2.5% | 2.9% |
| France PPI | 0.5% | 0.1% | 5.7% | 5.3% | 4.9% | 1.8% |
| Ex Energy | 0.4% | 0.2% | 2.9% | 3.3% | 3.0% | 2.8% |
| Italy PPI | 0.4% | 0.1% | 6.7% | 5.9% | 5.2% | 4.0% |
| Ex Energy | 0.5% | 0.0% | 2.8% | 2.8% | 3.0% | 4.4% |
| UK PPI | 1.3% | 1.3% | 24.8% | 18.7% | 7.9% | -1.4% |
| Ex Energy | 1.0% | 0.3% | 5.7% | 4.6% | 3.9% | 3.2% |
| Euro Area 15 Harmonized PPI excluding Construction | ||||||
| The EA 15 countries are Austria, Belgium, Cyprus, Finland, France, Germany, Greece, Ireland, Italy, Luxembourg, Malta, Netherlands, Portugal, Slovenia and Spain. | ||||||
by Robert Brusca March 4, 2008
| European GDP EU-13 | ||||||||||
|---|---|---|---|---|---|---|---|---|---|---|
| GDP | Consumption | Capital Formation | Trade | Domestic Demand |
||||||
| Private | Public | Total | Excl Housing |
Housing | X-M: Bil Euros |
Exports | Imports | |||
| % Change Q/Q; X-M is Q/Q Change in Bil of Euros | ||||||||||
| Q4-07 | 1.5% | -0.3% | -0.3% | 1.0% | #N/A | #N/A | #N/A | 2.2% | -1.5% | 0.0% |
| Q3-07 | 3.0% | 2.0% | 2.7% | 8.7% | 10.4% | 3.3% | -2.3 | 8.6% | 10.3% | 3.6% |
| Q2-07 | 1.1% | 2.5% | 0.7% | -5.6% | -5.7% | -5.5% | 5.0 | 3.2% | 1.2% | 0.3% |
| Q1-07 | 3.2% | 0.2% | 4.4% | 14.2% | 16.6% | 7.1% | -2.7 | 3.7% | 5.7% | 4.0% |
| % Change Yr/Yr; X-M is Yr/Yr Change in Gap in Bil of Euros | ||||||||||
| Q4-07 | 2.2% | 1.1% | 1.8% | 4.3% | #N/A | #N/A | #N/A | 4.4% | 3.8% | 1.9% |
| Q3-07 | 2.6% | 1.6% | 2.2% | 3.3% | 3.7% | 2.1% | 11.0 | 7.1% | 5.9% | 2.1% |
| Q2-07 | 2.4% | 1.6% | 2.1% | 3.1% | 3.4% | 2.4% | 8.8 | 5.8% | 5.0% | 2.0% |
| Q1-07 | 3.1% | 1.4% | 2.2% | 7.5% | 7.8% | 6.6% | 6.6 | 6.6% | 6.0% | 2.9% |
| 5-Yrs | 2.0% | 1.5% | 1.7% | 3.8% | #N/A | #N/A | na | 5.4% | 5.5% | 2.0% |

Tom Moeller
AuthorMore in Author Profile »Prior to joining Haver Analytics in 2000, Mr. Moeller worked as the Economist at Chancellor Capital Management from 1985 to 1999. There, he developed comprehensive economic forecasts and interpreted economic data for equity and fixed income portfolio managers. Also at Chancellor, Mr. Moeller worked as an equity analyst and was responsible for researching and rating companies in the economically sensitive automobile and housing industries for investment in Chancellor’s equity portfolio. Prior to joining Chancellor, Mr. Moeller was an Economist at Citibank from 1979 to 1984. He also analyzed pricing behavior in the metals industry for the Council on Wage and Price Stability in Washington, D.C. In 1999, Mr. Moeller received the award for most accurate forecast from the Forecasters' Club of New York. From 1990 to 1992 he was President of the New York Association for Business Economists. Mr. Moeller earned an M.B.A. in Finance from Fordham University, where he graduated in 1987. He holds a Bachelor of Arts in Economics from George Washington University.
More Economy in Brief


