 Global| Mar 05 2010
U.S. Unemployment Rate Steadies;Payrolls Fall Modestly
by:Tom Moeller
|in:Economy in Brief
Summary
Stabilization of labor market conditions was again evident in the latest report from the Bureau of Labor Statistics. From the household survey, the unemployment rate held steady for the second month at 9.7%, down from the October high [...]
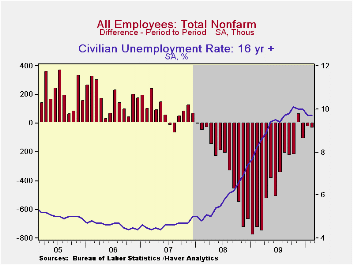
Stabilization of labor market conditions was again evident in the latest report from the Bureau of Labor Statistics. From the household survey, the unemployment rate held steady for the second month at 9.7%, down from the October high of 10.1%. In addition, the payroll survey indicated that a modest 36,000 jobs were lost. Consensus expectations had been for a slight uptick in the unemployment rate to 9.8% and a deeper payroll decline of 50,000.
The steady unemployment rate owed to a 308,000 increase (-2.1% y/y) in household employment following a 541,000 January gain. These increases follow monthly declines of as much as 967,000 during the recession. Moreover, the labor force started to expand, last month by 342,000, after a lesser January increase. Throughout 2009 the labor force contracted slightly. The labor force participation rate also rose slightly; for adult men, it ticked up to 74.0% and for adult women, it gained to 60.6%.
The 36,000 decline in February payrolls followed a 26,000 January slip that roughly equaled the initial estimate. However, the December decline of 109,000 was revised from a much deeper 150,000 estimated last month. The decline in payrolls in 2009 now totals 2.5%, half the recession peak. The three-month change is -0.1%.
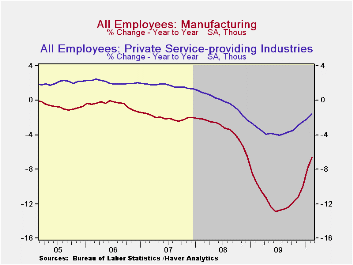
The lessened decline in February payrolls stemmed from a 1,000 worker increase in factory sector jobs which was just the second monthly gain in three years. Private-services payrolls also posted their third increase in the last four months while severe winter weather weighed on construction employment. The government indicated that most other employment categories were negatively affected by the mid-month blizzard that coincided with the employment survey week. Bucking this downward pressure was temporary employment which rose 47,500 (3.9% y/y) for the fifth straight monthly gain and the heath care sector (1.6% y/y). Government employment was notably weak in the local sector. It fell 31,000 while federal and state hiring both rose.
The diffusion index for employment, which measures the breath of hiring across industries, rose to 48.0%. That was up from the recession low of just 16.5% and was the highest in nearly two years. In the factory sector alone, the index showed net-hiring at 54.9%, the highest level in three years.
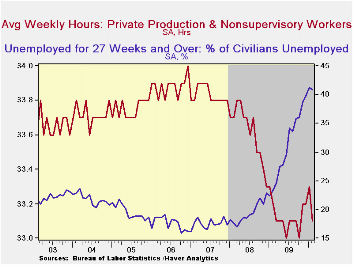
The total workweek suffered from the storm and fell to 33.1 hours which was its least since October. The length of the construction workweek fell most sharply. The factory workweek unwound three months of increase but, at 40.3 hours, was nevertheless up sharply from the recession low. The length of the private services workweek also held onto its improvement since the June low.
So far in the first quarter, aggregate hours worked (employment times hours) have risen at a 0.8% annual rate from 4Q after that quarter's 1.2% decline.
The figures referenced above are available in Haver's USECON database. Additional detail can be found in the LABOR and in the EMPL databases.
| Employment: 000s | February | January | December | Y/Y | 2009 | 2008 | 2007 |
|---|---|---|---|---|---|---|---|
| Payroll Employment | -36 | -26 | -109 | -2.5% | -4.3% | -0.6% | 1.1% |
| Previous | -- | -20 | -150 | -- | -- | -- | -- |
| Manufacturing | 1 | 20 | -18 | -6.6% | -11.3% | -3.4% | -2.0% |
| Construction | -64 | -77 | -36 | -13.7% | -15.7% | -6.1% | -0.8% |
| Private Service Producing | 42 | 20 | -29 | -1.6% | -3.4% | -0.2% | 1.7% |
| Government | -18 | 7 | -26 | -0.4% | 0.2% | 1.3% | 1.1% |
| Average Weekly Hours | 33.1 | 33.3 | 33.2 | 33.2 (Feb. '09) | 33.1 | 33.6 | 33.8 |
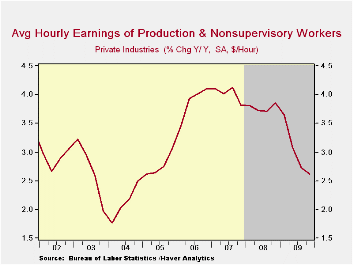
| Average Hourly Earnings | 0.2% | 0.3% | 0.3% | 2.5% | 3.0% | 3.8% | 4.0% |
| Unemployment Rate | 9.7% | 9.7% | 10.0% | 8.2% (Feb. '09) | 9.3% | 5.8% | 4.6% |
by Robert Brusca March 5, 2010
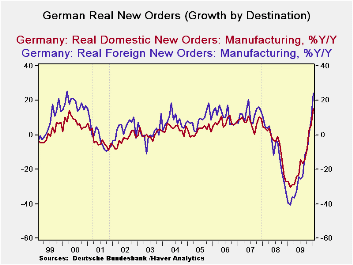
After dropping in December and raising eyebrows German orders have raised their game in January jumping by 4.3% month-to-month. Total orders are now accelerating steadily from twelve-months to six-months and from six-months to three-months.
Foreign orders rose by 1.9% month to month just offsetting the drop of 1.7% in December. But domestic orders surged by 7.1% a rise substantially more than offsetting the 1.3% drop in December. Does this means that the German domestic economy is now awakened and back in the game? A weak domestic economy has been the missing link to German improvement and to sustained EMU growth, which so far has been export led and therefore a bit uncertain. The German domestic economy still lags the foreign sector in terms of Yr/Yr order growth but it has now begun to surpass it over terms of 3-months and 6- months.
Real sector sales trends still show consumer demand dropping but that is all due to nondurables weakness. In January as consumer durables sales jumped by 3.5% that spurt added to growth in sales from capital goods at 2.3%, intermediate goods at 2.2%, and mining/MFG at 1.1%.
Getting Germany on a stronger growth track particularly because its domestic economy is heating up would be a very positive development for the Euro-Area where growth has been sputtering and problems on the financial side have been plaguing the outlook. One good German number does not seal the deal for a better outlook but it is a big step in the right direction and one that has been long in coming. This is not the first spurt in domestic orders we have seen in this cycle. In July of 2009 they surged by 9.3% only to fall and sputter over the next three months. It may be that the domestic order series is just lumpy, so we should hold our praise. But this is a good a sign and we should watch to see if the trend has legs.
| German Orders and Sales By Sector and Origin | ||||||||
|---|---|---|---|---|---|---|---|---|
| Real and SA | % M/M | % Saar | ||||||
| Jan-10 | Dec-09 | Nov-09 | 3-MO | 6-Mo | 12-Mo | YrAgo | QTR-2-Date | |
| Total Orders | 4.3% | -1.6% | 2.7% | 23.7% | 11.2% | 19.7% | -34.0% | 8.7% |
| Foreign | 1.9% | -1.7% | 3.6% | 16.2% | 7.8% | 24.2% | -39.6% | 2.1% |
| Domestic | 7.1% | -1.3% | 1.6% | 33.2% | 15.4% | 15.2% | -27.2% | 17.5% |
| Real Sector Sales | ||||||||
| MFG/Mining | 1.1% | -0.9% | 0.1% | 0.8% | 0.4% | 2.6% | -20.1% | -2.3% |
| Consumer | -4.6% | 2.1% | 1.8% | -3.4% | -1.7% | -3.0% | -9.9% | 4.0% |
| Cons Durables | 3.5% | -1.4% | 2.3% | 18.4% | 8.8% | -0.8% | -15.9% | 12.6% |
| Cons Non-Durable | -5.8% | 2.6% | 1.8% | -6.6% | -3.3% | -3.4% | -8.9% | 2.7% |
| Captial Gds | 2.4% | -1.3% | 0.4% | 6.2% | 3.0% | 3.0% | -25.4% | -4.5% |
| Intermediate Gds | 2.2% | -2.0% | -0.5% | -1.2% | -0.6% | 8.3% | -21.4% | -1.0% |
| All MFG-Sales | 1.0% | -0.8% | 0.1% | 0.8% | 0.4% | 2.6% | -20.3% | -2.1% |

Tom Moeller
AuthorMore in Author Profile »Prior to joining Haver Analytics in 2000, Mr. Moeller worked as the Economist at Chancellor Capital Management from 1985 to 1999. There, he developed comprehensive economic forecasts and interpreted economic data for equity and fixed income portfolio managers. Also at Chancellor, Mr. Moeller worked as an equity analyst and was responsible for researching and rating companies in the economically sensitive automobile and housing industries for investment in Chancellor’s equity portfolio. Prior to joining Chancellor, Mr. Moeller was an Economist at Citibank from 1979 to 1984. He also analyzed pricing behavior in the metals industry for the Council on Wage and Price Stability in Washington, D.C. In 1999, Mr. Moeller received the award for most accurate forecast from the Forecasters' Club of New York. From 1990 to 1992 he was President of the New York Association for Business Economists. Mr. Moeller earned an M.B.A. in Finance from Fordham University, where he graduated in 1987. He holds a Bachelor of Arts in Economics from George Washington University.
More Economy in Brief


