Global| Apr 13 2007
U.S. Trade Trends Fit of a Friday the 13th
Summary
The University of Michigan's consumer sentiment index has lost 11.6 points through mid-April to 85.3 from its January peak of 96.9 (Q1 1966 = 100). The reading of current conditions stands at 102.4, down from 111.3 in January, while [...]
| The flows in the table below are the detail behind the trade headlines. In February the US trade deficit shrank by a small amount to -$58.44 billion from -$58.88 billion in January. If we look at the inflation adjusted flows for the quarter to date versus Q4 2006 there is a slight deterioration implying some subtraction from GDP due to trade flows in Q1 2007. |
|---|
| Category | Current | Previous | $SA % SAAR | MEMO: | ||
| Feb.07 | MO % | MO % | 3-MO | 6-MO | Yr/Yr | Yr/Yr |
| Real Exports | -3.7% | 1.7% | -9.7% | -0.7% | 5.3% | 10.3% |
| Food, Feed, & Beverages | -2.5% | 5.2% | 24.7% | -12.4% | 7.3% | -0.2% |
| Industrial Materials | -4.0% | 1.8% | -16.4% | -0.7% | 5.4% | 0.5% |
| Capital Goods | -5.7% | 3.2% | -13.4% | -0.2% | 3.1% | 18.5% |
| Autos & Parts | 3.6% | -6.8% | 8.4% | -5.1% | 2.3% | 13.6% |
| Consumer Goods | -2.8% | 3.7% | 7.3% | 7.2% | 10.6% | 7.6% |
| Other | -3.6% | -3.5% | -46.5% | -0.4% | 14.9% | 15.5% |
| Real Imports | -1.9% | 0.3% | 0.5% | -3.8% | 2.6% | 4.0% |
| Food, Feeds, & Beverages | 0.5% | 0.9% | 6.9% | -0.4% | 4.1% | 5.8% |
| Industrial Materials | -7.7% | 3.6% | -4.9% | -17.5% | -9.3% | 0.8% |
| Capital Goods | -0.9% | 5.5% | 6.8% | 0.4% | 11.4% | 10.3% |
| Autos & Parts | -0.4% | -7.2% | -2.9% | -3.9% | -1.7% | 8.4% |
| Consumer Goods | 2.8% | -3.4% | 1.8% | 10.5% | 13.5% | -1.0% |
| Other | 0.2% | -2.6% | -3.8% | 4.4% | 5.8% | 5.2% |
| The table above is a table of inflation adjusted merchandise trade for the end use commodity designations used to categorize trade flows. They show some slight deterioration in the quarter-to-date trade balance. But the real story in this report is export and import weakness. These flows are all inflation-adjusted so oil has a minimal impact even on industrial materials, the category that contains it. For the month we can see all export categories decline. The table also tells a tale of weak export trends. Export trends weaken overall and are outright negative in three of four categories in February. But broader export trends weaken too, and this is even more disturbing. Overall real export growth rates drop from 10.3% a year ago, to 5.3% Yr/Yr as of February 2007. Then they drop to -0.7% over six months and to -9.7% over the most recent three months (all expressed as annual rates of change). This pronounced slowdown in exports is disturbing. For imports the slowing is not as dramatic but still is clear: from a 4% pace a year ago to a Yr/Yr pace of 2.6% currently. Then the pace drops off to -3.8% over six months slightly rebounds to an anemic +0.5% over three months (all expressed at annual rates). 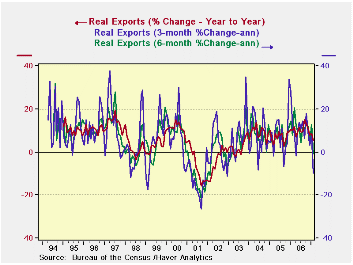 Meanwhile, over a fairly long period, the dollar has been falling. Weak US exports cannot be blamed on poor US competitiveness; US competitiveness has been improving. US export weakness suggests instead that growth overseas is weaker than what the IMF is saying in its recent WEO (World Economic Outlook). Meanwhile, over a fairly long period, the dollar has been falling. Weak US exports cannot be blamed on poor US competitiveness; US competitiveness has been improving. US export weakness suggests instead that growth overseas is weaker than what the IMF is saying in its recent WEO (World Economic Outlook).The weakness in export trends is quite apparent and does not seem to be the result of a normal statistical variation. The slowing seems real and economic instead of false and statistical in nature. For imports the slowing is more gradual and authentically fits in with the slowdown in the US economy, it may be this slowing that has transmitted weakness abroad and come back to haunt the US in the form of slower US exports abroad. 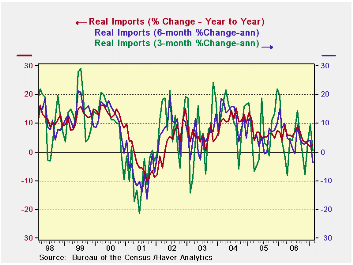 One thing about the world economy, for all its growth few regions have really developed much true domestic demand. US growth has been the lynchpin of world growth and as it has faded no other source of indigenous demand has cropped up. Japan has faltered, recent Germany’s weakness is exaggerated by its VAT introduction. Still Germany does not show that much strength except from external orders and exports.There is no pick up in local demand of any significant degree. While everyone remains upbeat on Europe it has yet to show it can prosper without export-led growth. The strong euro may already be putting it to a test too strong for it to pass. Is that the message in weak US exports? One thing about the world economy, for all its growth few regions have really developed much true domestic demand. US growth has been the lynchpin of world growth and as it has faded no other source of indigenous demand has cropped up. Japan has faltered, recent Germany’s weakness is exaggerated by its VAT introduction. Still Germany does not show that much strength except from external orders and exports.There is no pick up in local demand of any significant degree. While everyone remains upbeat on Europe it has yet to show it can prosper without export-led growth. The strong euro may already be putting it to a test too strong for it to pass. Is that the message in weak US exports? |
| Mar-07 | PPI Trends By Type Of Good | ||||
| PPI | 1-Mo (M/M) | 3-Mo, AR | 6-Mo, AR | 1-Yr | Yr-Ago |
| Total PPI | 1.0% | 6.9% | 5.2% | 3.1% | 3.6% |
| Finished Consumer Gds | 1.4% | 8.6% | 6.1% | 3.5% | 4.4% |
| Consumer Foods | 1.4% | 18.7% | 10.9% | 7.9% | -1.2% |
| Finished Consumer Goods Excl Foods | 1.3% | 5.1% | 4.3% | 1.9% | 6.6% |
| Nondurables less Food | 1.9% | 7.7% | 5.7% | 2.5% | 9.1% |
| Consumer Nondur ex Food & Energy | 0.4% | 5.9% | 3.5% | 2.3% | 3.0% |
| Durable Goods | -0.3% | -0.9% | 1.0% | 0.6% | 0.4% |
| Finished Core Consumer Goods | 0.1% | 3.1% | 2.4% | 1.5% | 1.9% |
| Capital Goods | -0.1% | 1.9% | 2.3% | 2.0% | 1.5% |
| Manufacturing Industries | 0.0% | 2.7% | 2.5% | 2.8% | 1.9% |
| Nonmanufacturing Industries | -0.1% | 1.4% | 2.2% | 1.6% | 1.3% |
| Core PPI | 0.0% | 2.3% | 2.3% | 1.6% | 1.7% |
| Memo: Finished Energy | 3.6% | 9.4% | 8.0% | 2.8% | 15.7% |
| The PPI has two headlines each month. One for the overall PPI, and one for the core. The core is the measure that excludes food and energy and that markets follow most closely. This month neither headline gives a true picture of what is going on in the PPI itself. As good as it gets… Inflation is neither as strong as the 1% headline on the PPI nor as docile as the 0% rise in the core. Not surprisingly, the truth lies in between. Core inflation is the measure we prefer and the Fed prefers. But the indicators that the Fed prefers to apply the core definition to are broader than the PPI: they are the PCE deflator or the CPI index. These measures include the services sector that the PPI leaves out. That sector has been much more inflation prone than the core goods sector that we can expose for examination in the PPI. So when you look at the core PPI you are usually seeing inflation as good as it gets.About that CPI signal… The table above gives us several readings on the PPI. The headline‘s main trend statistics are presented in the top line of the table; the PPI core is in the line that is second from the bottom. But the line that is more useful to us in the middle, entitled "finished core consumer goods". This is the part of the PPI that fits directly into the core CPI number that the Fed does care about. Notice that the core for the CPI at the producer level shows a rise of 0.1%. It is stronger than the PPI’s overall core because it excludes capital goods where prices fell in the month.And the CPI trends? Don’t ask…. Even more troubling than this minor one-tick change for the core as it applies to consumer goods is the adverse trend for this CPI Core series at the producer level. Finished core consumer goods at the producer level (FCCPPI) show steadily accelerating inflation. This is despite the small 0.1% up tick in March. Inflation has stepped up from 1.5% over 12-months to 2.4% over six months to 3.1% over three months (all SAAR). This progression is disturbing. Within the FCCPPI we find conflicting trends. Nondurable goods excluding energy and food are up by 0.4% in March and have their own -- much higher -- inflation progression in train (see table). But durable goods are tempered. Indeed, durable goods prices fell in March and they are showing a mixed tendency to decelerate over the course of the past year (see table). |
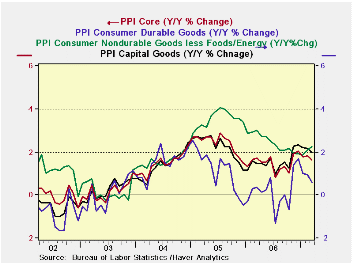 The chart on the left looks at these trends using only the Yr/Yr tabulations Even so we can see that consumer durable goods inflation trends are turning lower. The upturn in nondurable core trends is also apparent as it turns higher. Capital goods trends are shown to hover at an inflation pace of about 2%. The core PPI, torn between these various trends, is in a slight downtrend itself.What’s the point of a sullied point estimate? The chart on the left looks at these trends using only the Yr/Yr tabulations Even so we can see that consumer durable goods inflation trends are turning lower. The upturn in nondurable core trends is also apparent as it turns higher. Capital goods trends are shown to hover at an inflation pace of about 2%. The core PPI, torn between these various trends, is in a slight downtrend itself.What’s the point of a sullied point estimate?If I can make an obvious point here it is that with such disparate trends within the core PPI, it is obvious that the core is not very representative of its components. You can average (or weight-average) anything. But that does not make the resulting measure useful. We assert that the core inflation measure from the PPI is simply not useful in these circumstances. While we do need some assessment on the overall price level to tell what it is doing, (the Fed surely does) it should be clear that with important components moving in different directions final judgment depends on the weight applied to each. And since weighting is a controversial issue we would urge a great deal of caution in dealing with the trends core measures produce when components are flying every which way. If you peruse the chart on the left on component PPI Core trends you can see that this sort of trend convolution is not the norm. While the various core components often have differing rates of inflation, the direction is usually about the same even if the speed is not. Developments in PPI core inflation in early 2007 are odd indeed. On balance, the PPI is a report that can please no one. Inflation is still in a sort of twilight zone: too high to be comfortable but with yet enough moderation for the Fed to play along with it for a while – if it so chooses. And there are plenty of convoluted – or at least contrary - trends to choose from within the PPI core. What is most disturbing however is the knowledge that inflation in services tends to be stronger. That seems to imply that an uncomfortable CPI still lies ahead. The core goods portion of inflation has been the best behaved part of the CPI for some time. Inflation is now most troublesome in the services sector. As we move on to measures that include that sector next week with a goods sector inflation rate in hand that is itself a bit uncomfortable, disappointment seems to be the most likely result. Be prepared… |
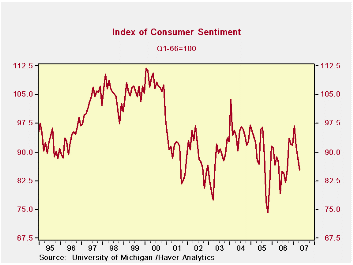
The University of Michigan's consumer sentiment index has lost 11.6 points through mid-April to 85.3 from its January peak of 96.9 (Q1 1966 = 100). The reading of current conditions stands at 102.4, down from 111.3 in January, while expectations are at 74.3 from January's 87.6. These declines have come in roughly equal installments in February, March and early April.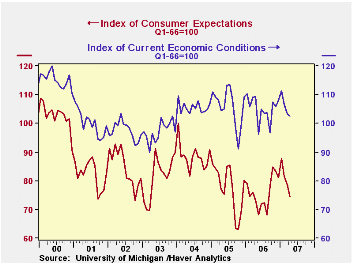
Consumers' reading of personal finances has fallen to 112 in early April from 123 in January, but is actually up from 111 in March. A few more people have rising incomes and a few less have lower incomes, both helping this component. But a growing number of respondents are saying their purchasing power is suffering from higher prices, even though their income position looks better. Survey participants see buying conditions deteriorate for "large household goods"; even among those who say this is a "good time to buy" a rising number give the reason that prices will go up, so buy now before that happens.
The fall in the expectations component results from concern over general business conditions. Fewer people look for "good times" and more people look for "bad times". However, they remained generally positive about their own personal finances: those looking to be "better off" did edge down by 1 percentage point from January but those expecting to be "worse off" fell by 2 points.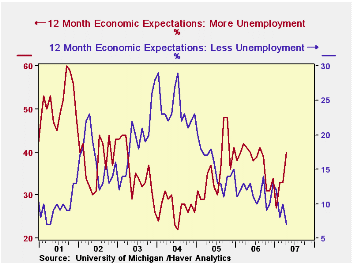
Inflation and unemployment expectations both contributed to the deterioration in sentiment. Median inflation expectations rose to 3.3% from 3% in January, February and March; the mean is 4.1%. Both figures are the highs since the high energy price period last summer. The unemployment outlook worsened as the smallest number of people since the 2001 recession expect "less unemployment" while the number expecting "more unemployment" returned to 40%, a kind of threshold of concern that has recently coincided with high energy price periods and was last breached in August.
The University of Michigan survey is not seasonally adjusted.This mid-month survey was based on telephone interviews with about 304 households nationwide on personal finances and business and buying conditions. The survey is expanded to a total of 500 interviews at month-end.
| University of Michigan | April (Prelim) | March | February | Y/Y | 2006 | 2005 | 2004 |
|---|---|---|---|---|---|---|---|
| Consumer Sentiment | 85.3 | 88.4 | 91.3 | -2.4% | 87.3 | 88.5 | 95.2 |
| Current Conditions | 102.4 | 103.5 | 106.7 | -6.2% | 105.1 | 105.9 | 105.6 |
| Expectations | 74.3 | 78.7 | 81.5 | +1.2% | 75.9 | 77.4 | 88.5 |

Robert Brusca
AuthorMore in Author Profile »Robert A. Brusca is Chief Economist of Fact and Opinion Economics, a consulting firm he founded in Manhattan. He has been an economist on Wall Street for over 25 years. He has visited central banking and large institutional clients in over 30 countries in his career as an economist. Mr. Brusca was a Divisional Research Chief at the Federal Reserve Bank of NY (Chief of the International Financial markets Division), a Fed Watcher at Irving Trust and Chief Economist at Nikko Securities International. He is widely quoted and appears in various media. Mr. Brusca holds an MA and Ph.D. in economics from Michigan State University and a BA in Economics from the University of Michigan. His research pursues his strong interests in non aligned policy economics as well as international economics. FAO Economics’ research targets investors to assist them in making better investment decisions in stocks, bonds and in a variety of international assets. The company does not manage money and has no conflicts in giving economic advice.
More Economy in Brief