 Global| Jul 03 2014
U.S. Trade Trends Converge Temporarily
Summary
The US merchandise trade deficit contracted to $44.4 billion in May from $47 billion in April. On the month, exports rose by 1% as imports fell by 0.3%, providing the impetus for the trade balance contraction. Merchandise exports grew [...]
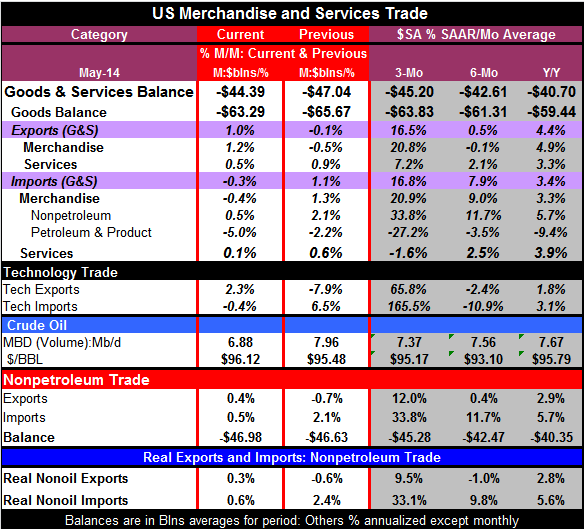
 The US merchandise trade deficit contracted to $44.4 billion in May from $47 billion in April. On the month, exports rose by 1% as imports fell by 0.3%, providing the impetus for the trade balance contraction. Merchandise exports grew by 1.2% on the month while nonpetroleum merchandise imports rose by 0.5%. The overall merchandise import figure fell by 0.4% because petroleum and product imports fell by five percentage points month-to-month.
Looking at broader trends, merchandise exports have risen by 4.9% year-over-year while nonpetroleum merchandise imports are up by 5.7%. That's pretty much in balance with a slight edge to nonoil imports. Over six months, merchandise exports fell at a 0.1% annual rate with nonpetroleum imports surging ahead at an 11.7% pace. Over three months. Merchandise exports are shooting ahead at a 20.8% rate with nonpetroleum merchandise imports exploding at a 33.8% annual rate.
Typically imports, especially nonpetroleum imports, are a good barometer of US domestic demand. Recently there have been a number of reports that turned higher, including the three-month run of very strong nonfarm job gains, one of which was just posted today. Together with the surge in imports that is now recorded over the last three months, we have some further confirmation that consumer demand may really be picking up. As a caveat to that, we do see very strong auto sales, over 16 million units at an annual rate for the last four months running. However, non-auto to retail sales have not been nearly as robust. Making the assessment of the economy even more difficult is the sharp 3% drop in GDP in the first quarter and the appearance that the second quarter is not going to be strong enough to put that drop at bay. Yet other statistics are showing growth and rebound.
We can further dissect export and import trends by looking at the inflation-adjusted and end-use trade figures which sort the trade flows in the various categories. On this basis, real export growth of 4.3% is ahead of real import growth, which is up by only 3% over the last 12 months. Exports are up by over 12% for foods, feeds and beverages, by 3% for industrial supplies and materials, by 9% for consumer goods, and by 15% for other exports. Capital goods exports are up by 1.1% and autos imparts exports are up by 3.3%.
The end-use real flows show real imports that are up by only 3% year-over-year. But auto and parts are up by 9.6%; capital goods are up by 8.7% year-over-year. Also higher year-over-year foods, feeds and beverages imports are up by 3.5% and consumer goods are up by 2.6%. Falling year-over-year are other real imports; they are off by nearly 12% and industrial materials are off by 2.5%.
Looking over three-month horizon, the end-use data show the same circumstances as in the table below but with slightly different numbers. Real imports are up at a 22% pace with real exports up at an 18% pace. The import growth rates are terrific for food, feeds and beverages, up at a 40% annual rate. Autos and parts imports are up at a 53% annual rate followed by (other) consumer goods at a 33% annual rate. Capital goods imports are up at a 29% annual rate and other imports at a 22% annual rate. Falling are imports of industrial supplies and materials. This is a category that is likely affected by less US dependence on energy imports from abroad.
The export flows over three months show some real strength as autos and parts exports soar at a 48% annual rate. `Other' exports are up at an 83% annual rate and industrial supplies and materials are up at a 24% annual rate. Capital goods exports are up at a 15% annual rate. Also increasing are consumer goods, where exports are up at a 1.3% annual rate. But exports of foods, feeds and beverages are off at a 14% annual rate.
On balance, imports pretty much picked up across the board. This would appear to be further confirmation of an improvement in US domestic demand. Of course, there is a chance that some of these goods are going into inventories rather than reflecting current expenditures. But with such widespread increases in import flows, it is much more likely that these imports are reflective of actual spending rather than just inventory building.
In short, the US trade picture is making a sharp turn. With imports beginning to rise strongly, the US trade deficit is likely to begin to increase. As we can see in the growth rates for exports and imports, imports are really starting to overtake exports. While increased US energy independence will help to stave off demand for petroleum and product imports, even with this effect in place, it's looking like import growth is running well ahead of export growth. When we look at the table under US nonpetroleum trade, we see that imports over three months are growing at a 33.8% pace compared with a 12% pace for exports. And when we look at these flows in real terms, we see three-month export growth at 9.5% with real nonoil imports growing at 33.1%.
The trade report points in two different directions. For this month, we have a slightly smaller deficit, something that will contribute to boosting GDP. But the trends are pointing to the opposite effect, to growing imports with exports accelerating, but still, trailing import trends. The good news is that stronger imports point to stronger domestic demand and to a revival in US growth, something that is much desired and long-overdue. The stronger imports are likely to drive the trade balance into deeper deficit and to subtract from growth. We can applaud the revival of demand. But we still need to find a way to satisfy more of it through goods produced at home with the exception of energy that goal appears to be still elusive.

Robert Brusca
AuthorMore in Author Profile »Robert A. Brusca is Chief Economist of Fact and Opinion Economics, a consulting firm he founded in Manhattan. He has been an economist on Wall Street for over 25 years. He has visited central banking and large institutional clients in over 30 countries in his career as an economist. Mr. Brusca was a Divisional Research Chief at the Federal Reserve Bank of NY (Chief of the International Financial markets Division), a Fed Watcher at Irving Trust and Chief Economist at Nikko Securities International. He is widely quoted and appears in various media. Mr. Brusca holds an MA and Ph.D. in economics from Michigan State University and a BA in Economics from the University of Michigan. His research pursues his strong interests in non aligned policy economics as well as international economics. FAO Economics’ research targets investors to assist them in making better investment decisions in stocks, bonds and in a variety of international assets. The company does not manage money and has no conflicts in giving economic advice.
More Economy in Brief


