 Global| Mar 11 2008
U.S. Trade Deficit Widened
by:Tom Moeller
|in:Economy in Brief
Summary
During January the U.S. foreign trade deficit widened to $58.2B from a revised $57.9B in December, which was shallower than initially reported. Consensus expectations had been for a deficit of $59.6B. Lifted by the weaker dollar, U.S. [...]
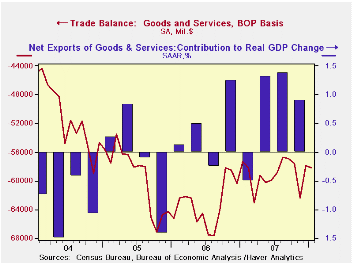
During January the U.S. foreign trade deficit widened to $58.2B from a revised $57.9B in December, which was shallower than initially reported. Consensus expectations had been for a deficit of $59.6B.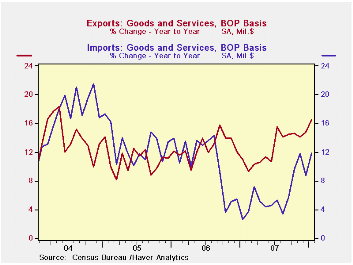
Lifted by the weaker dollar, U.S. exports during January again were strong. They posted a 1.6% jump following the unrevised 1.5% December gain. Exports of goods rose 1.3% (15.2% y/y) as exports of foods, feeds & beverages surged. A 7.6% m/m jump in food exports lifted the y/y rise to 42.0%. Exports of industrial supplies & materials also were quite strong and jumped 2.8% (25.1% y/y). Exports of capital goods have wobbled during the last several months and fell 1.3% (+7.6% y/y) during January. Weaker exports of civilian aircraft accounted for most of that wobble, declining 12.6% (+10.8% y/y). Exports of computers rose 5.2% (6.3% y/y) while exports of nonauto consumer goods were again strong and rose 3.8% (12.9 y/y).
U.S. exports of services in January jumped 1.8% (18.2% y/y). Travel exports rose 26.0% y/y and passenger fares were up 27.6%.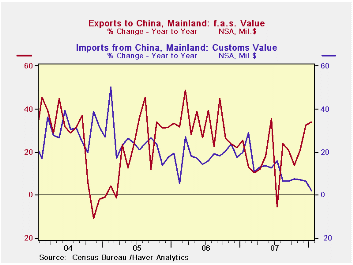
Overall imports fully reversed the December decline and rose 1.3%. Higher oil prices raised nominal petroleum imports by 10.6%. Petroleum imports in constant dollars, however, rose a lesser 8.8% m/m and in fact fell 1.6% during the last twelve months. In constant dollars, imports of nonauto consumer goods reflected the weaker U.S. economy and fell 4.6% (-0.8% y/y) while real capital goods imports fell 0.4% (+2.4% y/y).
The U.S. trade deficit in goods with China deepened m/m to $20.3B but that remained well below last year's monthly record of $25.9B. Growth in imports from China has slowed to 2.1% during the last twelve months after growth between 10% and 30% during the last several years. Exports to China for January showed a 15.1% decline but that followed huge gains during the past several years, also between 10% and 30%.
G-10 central banks announced measures and will consult regularly on liquidity pressures in funding markets. The statement by the Federal Reserve can be found here
| Foreign Trade | January | December | Y/Y | 2007 | 2006 | 2005 |
|---|---|---|---|---|---|---|
| U.S. Trade Deficit | $58.2B | $57.9B | $57.4B (1/07) |
$708.5 | $758.5 | $714.4B |
| Exports - Goods & Services | 1.6% | 1.5% | 16.6% | 12.6% | 12.7% | 10.9% |
| Imports - Goods & Services | 1.3% | -1.2% | 11.9% | 6.0% | 10.4% | 12.9% |
| Petroleum | 10.6% | 3.6% | 59.0% | 9.5% | 20.1% | 39.6% |
| Nonpetroleum Goods | -1.1% | -2.9% | 2.5% | 4.6% | 9.1% | 10.3% |

Tom Moeller
AuthorMore in Author Profile »Prior to joining Haver Analytics in 2000, Mr. Moeller worked as the Economist at Chancellor Capital Management from 1985 to 1999. There, he developed comprehensive economic forecasts and interpreted economic data for equity and fixed income portfolio managers. Also at Chancellor, Mr. Moeller worked as an equity analyst and was responsible for researching and rating companies in the economically sensitive automobile and housing industries for investment in Chancellor’s equity portfolio. Prior to joining Chancellor, Mr. Moeller was an Economist at Citibank from 1979 to 1984. He also analyzed pricing behavior in the metals industry for the Council on Wage and Price Stability in Washington, D.C. In 1999, Mr. Moeller received the award for most accurate forecast from the Forecasters' Club of New York. From 1990 to 1992 he was President of the New York Association for Business Economists. Mr. Moeller earned an M.B.A. in Finance from Fordham University, where he graduated in 1987. He holds a Bachelor of Arts in Economics from George Washington University.
More Economy in Brief


