 Global| Mar 11 2010
U.S. Trade Deficit Unexpectedly Moves Lower
by:Tom Moeller
|in:Economy in Brief
Summary
Though the recession has ended, Americans' appetite for imported products remained under wraps last month. As a result, the U.S. foreign trade deficit improved to $37.3B from a little-revised $39.9B during December. The latest figure [...]
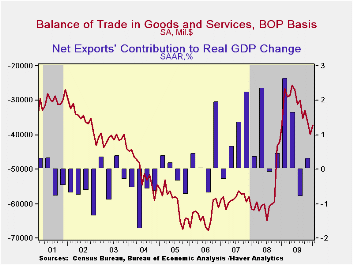
Though the recession has ended, Americans' appetite for imported products remained under wraps last month. As a result, the U.S. foreign trade deficit improved to $37.3B from a little-revised $39.9B during December. The latest figure was lower than Consensus expectations for a deficit of $41.0B.
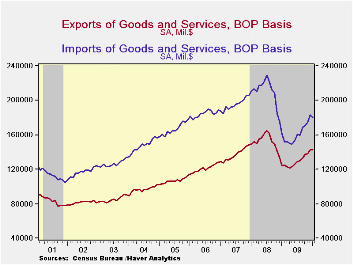
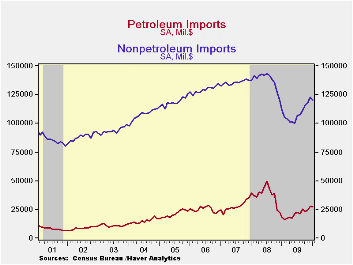
Perhaps showing the effects of the lower dollar imports fell 1.7% and reversed much of their December gain. Nevertheless, though monthly imports fell, the y/y growth accelerated to 11.9% with higher oil prices and the budding economic recovery. For the month, imports of petroleum products fell 3.1% but that factored little into an annual gain of roughly 50%. That reflected the near-doubling of energy prices which included crude oil rising to $73.89 per barrel. The price shock did not come, however, without a demand reaction. The quantity of petroleum imports fell 19.9% y/y following declines during the prior three years.
Outside of oil, imports did tick 2.0% lower during January as volumes slipped. However, versus last year non-oil imports rose 8.0% with the economic recovery following a 21.0%, recession-related decline for all of last year. In constant dollars, January real nonoil imports rose 7.0% as part of a nearly one-half y/y recovery in automotive vehicles & parts imports. Real nonauto consumer goods imports slipped for the second month but y/y they have grown 2.1% following a 10.8% decline during 2009. Capital goods imports also have recovered. Year-to-year growth of 7.2% spells recovery after a 18.0% drop last year. That came despite a 2.9% m/m January decline. Finally, services imports rose another 0.4% (4.1% y/y) after a sharp 1.4% December gain. U.S. travels abroad slipped 0.8% (-0.9% y/y) after a sharp December increase. Passenger fares slipped 0.4% (-6.7% y/y) but "other" transportation charges jumped 1.7% (4.9% y/y).
Continuing to reflect the competitive value of the dollar, nominal exports slipped just 0.3% m/m (+15.1% y/y) after the 3.4% jump during December. Though real merchandise exports fell 1.6% from December, the y/y gain of 14.2% is the strongest since early-2008. Real capital goods exports fell 2.6% (+4.3% y/y) and auto exports fell 5.7% (+61.8% y/y). Offsetting these declines was a 1.3% increase (17.7% y/y) in real exports of non-auto consumer goods. Exports of services ticked up 0.4% (6.4% y/y) for the third month of slight increase.
By country, the trade deficit with mainland China held roughly steady at $18.3B. That's still near its least since April and the deficit is down from its peak of $27.9B in October of 2008. Exports to China rose by nearly two-thirds y/y while imports rose just 1.8%. With Japan, the trade deficit improved to $3.3B from $4.3B one year earlier as exports rose 21.2% and imports fell 1.3%. With the European Union, the trade deficit narrowed to $2.8B, near its least since 1999 as exports rose 5.7% y/y and imports increased just 1.5%.
The international trade data can be found in Haver's USECON database. Detailed figures are available in the USINT database.
Okun's Law: Output & Unemployment from the Federal Reserve Bank of St. Louis is available here here.
| Foreign Trade | January | December | November | Y/Y | 2009 | 2008 | 2007 |
|---|---|---|---|---|---|---|---|
| U.S. Trade Deficit | $37.3B | $39.9B | $36.1B | $36.9B (1/09) | $378.6B | $695.9B | $701.4B |
| Exports - Goods & Services | -0.3% | 3.4% | 0.9% | 15.1% | -14.9% | 11.2% | 13.2% |
| Imports - Goods & Services | -1.7 | 4.9 | 2.6 | 11.9 | -23.4 | 7.6 | 6.0 |
| Petroleum | -3.1 | 15.1 | 7.4 | 48.9 | -44.1 | 37.0 | 9.4 |
| Nonpetroleum Goods | -2.0 | 3.8 | 2.3 | 8.0 | -21.0 | 1.5 | 4.8 |

Tom Moeller
AuthorMore in Author Profile »Prior to joining Haver Analytics in 2000, Mr. Moeller worked as the Economist at Chancellor Capital Management from 1985 to 1999. There, he developed comprehensive economic forecasts and interpreted economic data for equity and fixed income portfolio managers. Also at Chancellor, Mr. Moeller worked as an equity analyst and was responsible for researching and rating companies in the economically sensitive automobile and housing industries for investment in Chancellor’s equity portfolio. Prior to joining Chancellor, Mr. Moeller was an Economist at Citibank from 1979 to 1984. He also analyzed pricing behavior in the metals industry for the Council on Wage and Price Stability in Washington, D.C. In 1999, Mr. Moeller received the award for most accurate forecast from the Forecasters' Club of New York. From 1990 to 1992 he was President of the New York Association for Business Economists. Mr. Moeller earned an M.B.A. in Finance from Fordham University, where he graduated in 1987. He holds a Bachelor of Arts in Economics from George Washington University.
More Economy in Brief


