 Global| Jul 10 2009
U.S. Trade Deficit Shrinks WithRecession To Its Lowest Since 1999
by:Tom Moeller
|in:Economy in Brief
Summary
The U.S. foreign trade deficit reached its lowest level since 1999 as the recession lowered imports enough to offset the rise in oil prices. The deficit of $26.0B shrank from the revised April level of $28.8B. (Data revisions extend [...]
 The
U.S. foreign trade deficit reached its lowest level since 1999 as the
recession lowered imports enough to offset the rise in oil prices. The
deficit of $26.0B shrank from the revised April level of $28.8B. (Data
revisions extend back to 2006.) Consensus expectations had been for an
overall May trade deficit of $30.0B. Exports rose for just the second
month this year. Nonetheless, recessions abroad have lowered exports by
7.2% just since December. U.S. imports similarly fell with the
recession, but the decline also reflected lower oil costs. Nonpetroleum
imports ticked up 0.1% from April but remained down 28.7% from last
year. They have fallen 14.8% since December. Petroleum imports fell
3.4% as reduced usage (volumes) offset the m/m rise in prices. So far
this year petroleum imports have fallen 23.1%.
The
U.S. foreign trade deficit reached its lowest level since 1999 as the
recession lowered imports enough to offset the rise in oil prices. The
deficit of $26.0B shrank from the revised April level of $28.8B. (Data
revisions extend back to 2006.) Consensus expectations had been for an
overall May trade deficit of $30.0B. Exports rose for just the second
month this year. Nonetheless, recessions abroad have lowered exports by
7.2% just since December. U.S. imports similarly fell with the
recession, but the decline also reflected lower oil costs. Nonpetroleum
imports ticked up 0.1% from April but remained down 28.7% from last
year. They have fallen 14.8% since December. Petroleum imports fell
3.4% as reduced usage (volumes) offset the m/m rise in prices. So far
this year petroleum imports have fallen 23.1%.
Adjusted for price inflation, the trade deficit in goods also narrowed to $36.2B, the lowest since 1999. It was down from $49.3B last May.
Crude oil prices rose to an average of $51.21 per barrel versus the February low of $39.22. Nevertheless, prices still were down 51.9% from last May. As mentioned above, despite higher oil prices, the overall value of petroleum imports fell 3.4% during May but the quantity imported fell 12.9% and 9.7% y/y with the recession.
 Real
non-auto consumer goods
imports fell 14.1% y/y and remained near their lowest level since 2005
while imports of automotive vehicles & parts were down by
exactly one-half. Non-auto capital goods imports continued to reflect
the weakness in investment and fell 25.9% y/y to their lowest since
2004.
Real
non-auto consumer goods
imports fell 14.1% y/y and remained near their lowest level since 2005
while imports of automotive vehicles & parts were down by
exactly one-half. Non-auto capital goods imports continued to reflect
the weakness in investment and fell 25.9% y/y to their lowest since
2004.
ervices imports fell another 1.3%, as they did in April (-11.9% y/y), and were down for the ninth consecutive month. Travel imports were down 14.7% during that period as passenger fares dropped by 25.4%.
Though real exports rose 1.9% month-to-month, recessions abroad caused them to fall by 18.8% year-to-year to the lowest level since late-2005. The chained dollar value of non-auto consumer goods exports reversed some of the April decline but remained down 9.9% y/y. Real capital goods exports ticked up 0.4% but were off 19.5% y/y while exports of automobiles & parts were off by nearly one-half from last year.
 Nominal
exports of services
slipped 0.4% for the month but
they were down 12.4% y/y. Travel exports fell 22.5% y/y as fewer
foreign citizens came to the U.S. even as passenger fares fell 22.3%.
Nominal
exports of services
slipped 0.4% for the month but
they were down 12.4% y/y. Travel exports fell 22.5% y/y as fewer
foreign citizens came to the U.S. even as passenger fares fell 22.3%.
The U.S. trade deficit in goods with China deepened just slightly to $16.8B but remained near the lowest level since early-2006. Imports from China fell 15.5% y/y but U.S. exports fell a lesser 8.6%. The trade deficit with Japan also deepened slightly to $3.2B but it remained near its shallowest since 1990. The U.S. recession drove imports from Japan down by roughly one-half year-to-year while exports fell by 29.1%.
The international trade data can be found in Haver's USECON database. Detailed figures are available in the USINT database.
Today's House testimony by Fed vice-Chairman Donald L. Kohn titled Federal Reserve Independence can be found here.
| Foreign Trade | May | April | Y/Y | 2008 | 2007 | 2006 |
|---|---|---|---|---|---|---|
| U.S. Trade Deficit | $26.0B | $28.8B | $60.5B (7/08) | $695.9 | $701.4 | $760.4 |
| Exports - Goods & Services | 1.6% | -2.0% | -21.3% | 11.2% | 13.2% | 13.3% |
| Imports - Goods & Services | -0.6% | -1.5% | -31.3% | 7.6 | 6.0% | 10.8% |
| Petroleum | -3.4% | 1.8% | -56.3% | 37.0% | 9.4% | 20.1% |
| Nonpetroleum Goods | 0.1% | -2.1% | -28.7% | 1.5% | 4.8% | 9.1% |
by Robert Brusca July 10, 2009
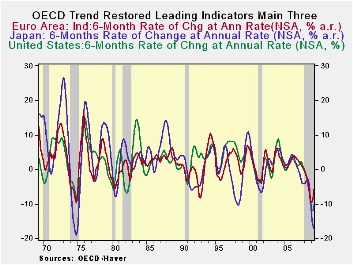
The OECD LEIs are giving off much more optimistic signals
theses days. Ordinary progressive growth rates ( 12-mo to 6-mo to 3-mo)
in the table’s top panel show that decelerations in the indicators have
ceased across the OECD area for these major groupings. Japan is still
declining over three-months, however, its pace of decline has been cut.
The US, the e-Area and the OECD area as whole show positive three-month
growth rates as of May.
In the chart’s bottom panel we look at six month interval
growth rates since the OECD prefers this horizon for its trend-restored
leading indicators. On this basis decelerations in the indicators have
stopped across these main OECD grouping except in Japan. Only the
e-Area is showing an increase in its indicator over six months. The US
pace of decline in the OECD indictor has been cut sharply over the
recent six months, compared to six month ago. Given its embedded
patterns, the US indicator over six months should be showing advances
in one or two months as long as there is no backsliding.
On balance the OECD trend-restored leading indicts are giving
off positive signals. Every major region is showing some progress.
Japan which is still having the most difficult time is making progress
in its short term growth gauges not at the six-month horizon that the
OECD prefers. Still, it’s progress.
| Growth progression-SAAR | ||||
|---|---|---|---|---|
| 3Mos | 6Mos | 12mos | Yr-Ago | |
| OECD | 4.9% | -2.7% | -8.2% | -2.2% |
| OECD7 | 3.2% | -4.9% | -9.8% | -2.7% |
| OECD.E Area | 9.1% | 1.8% | -5.8% | -2.7% |
| OECD. Japan | -11.9% | -18.1% | -17.1% | -3.0% |
| OECD US | 4.0% | -5.4% | -10.3% | -2.4% |
| Six month readings at 6-Mo Intervals: | ||||
| Recent six | 6Mo Ago | 12Mo Ago | 18MO Ago | |
| OECD | -2.7% | -13.4% | -2.9% | -1.5% |
| OECD7 | -4.9% | -14.5% | -3.2% | -2.2% |
| OECD.Eur | 1.8% | -12.9% | -4.5% | -0.9% |
| OECD.Japan | -18.1% | -16.1% | -0.6% | -5.4% |
| OECD US | -5.4% | -15.0% | -3.0% | -1.7% |
| Slowdowns indicated by BOLD RED | ||||
by Tom Moeller July 10, 2009
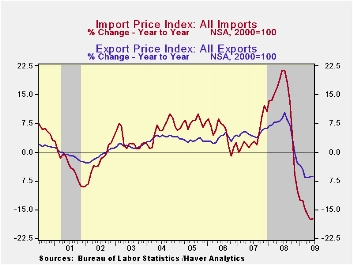 U.S.
import
prices last month continued rising with oil prices. The 3.2% rise was
more than Consensus expectations for a 2.1% gain and it more than
doubled the unrevised May increase of 1.4%. However, as has
been the case, earlier severe price declines at the start of the global
economic recession left the y/y change in import prices a negative
17.4%.
U.S.
import
prices last month continued rising with oil prices. The 3.2% rise was
more than Consensus expectations for a 2.1% gain and it more than
doubled the unrevised May increase of 1.4%. However, as has
been the case, earlier severe price declines at the start of the global
economic recession left the y/y change in import prices a negative
17.4%.
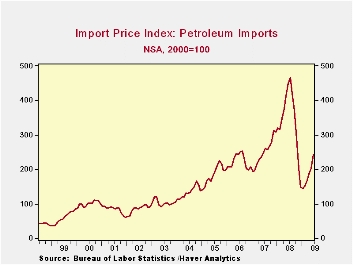
Higher petroleum prices have accelerated recent import price gains. The 20.3% increase last month was the strongest of the last five consecutive monthly increases. This month, however, the rally in crude oil reversed and the price for a barrel of Brent Crude oil fell yesterday to $59.19 from the June average of $68.73.
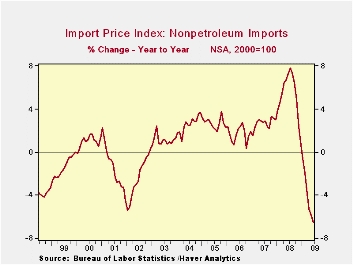 Non-oil
import prices continued to firm as well with the lower value of the
dollar as well as a firming U.S. economy. The 0.2% uptick in June,
combined with a slight downward revision to May prices, left them
roughly flat over the last three months. This stability compares to
three-month price declines of 3.5% as recently as this past January.
(During the last ten years, there has been a negative 81% correlation
between the nominal trade-weighted exchange value of the US dollar vs.
major currencies and the y/y change in non-oil import prices.)
Non-oil
import prices continued to firm as well with the lower value of the
dollar as well as a firming U.S. economy. The 0.2% uptick in June,
combined with a slight downward revision to May prices, left them
roughly flat over the last three months. This stability compares to
three-month price declines of 3.5% as recently as this past January.
(During the last ten years, there has been a negative 81% correlation
between the nominal trade-weighted exchange value of the US dollar vs.
major currencies and the y/y change in non-oil import prices.)
Leading the strength in import prices last month was a 0.5% increase in foods prices but they still remained 5.2% lower than last year. Prices for nonauto consumer goods ticked up 0.1% but, here again, there has been firming versus earlier declines. The three-month rate of change amounted to 0.3% which compared to a -0.7% change as recently as January. Durable consumer goods prices rose 0.5% over the last three months after a -1.7% decline through January. Household goods and home entertainment equipment prices have firmed considerably. Moving the other way, declines in apparel prices have offset some of that strength in durables.
 During June, capital goods import prices slipped 0.1%
(-1.5% y/y) after no change during May. On a three-month basis, prices
were unchanged after the 0.9% rate of decline through March.
Excluding computers, capital goods prices have firmed and three-month
growth in prices rose to 0.1% from the low of -0.7%. Prices of
computers, peripherals & accessories slipped 0.5% last month
but the unchanged level over the last three compares with a 5.8%
decline over the last year.
During June, capital goods import prices slipped 0.1%
(-1.5% y/y) after no change during May. On a three-month basis, prices
were unchanged after the 0.9% rate of decline through March.
Excluding computers, capital goods prices have firmed and three-month
growth in prices rose to 0.1% from the low of -0.7%. Prices of
computers, peripherals & accessories slipped 0.5% last month
but the unchanged level over the last three compares with a 5.8%
decline over the last year.
Total export prices have firmed and accompanied the gains in import prices. Last month they rose 1.1%. That followed a revised 0.5% May gain which was half that reported last month. The latest gain was led by a 4.8% (-12.5% y/y) rise in agricultural prices. Nonagricultural export prices also firmed and rose 0.8% (-5.7% y/y). Over the last three months they were up 1.2% following a -6.0% decline as of the end of last year.
The import and export price series can be found in Haver's USECON database. Detailed figures are available in the USINT database.
| Import/Export Prices (NSA, %) | June | May | Y/Y | 2008 | 2007 | 2006 |
|---|---|---|---|---|---|---|
| Import - All Commodities | 3.2 | 1.4 | -17.4 | 11.5 | 4.2 | 4.9 |
| Petroleum | 20.3 | 9.3 | -45.9 | 37.7 | 11.6 | 20.6 |
| Nonpetroleum | 0.2 | 0.1 | -6.5 | 5.3 | 2.7 | 1.7 |
| Export - All Commodities | 1.1 | 0.5 | -6.4 | 6.0 | 4.9 | 3.6 |
by Tom Moeller July 10, 2009
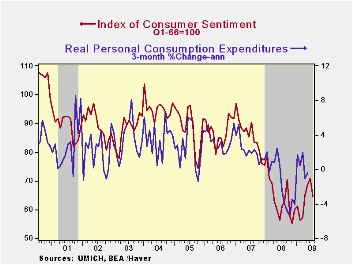 Worries
about the prospects for the economy and its current position dropped
the University of Michigan's July reading of consumer sentiment. The
mid-July overall figure fell to 64.6 which was its lowest level since
March. Consensus expectations had been for a reading of 71.0. During
the last ten years, there has been a 61% correlation between the level
of sentiment and the growth in real spending during the next five
months.
Worries
about the prospects for the economy and its current position dropped
the University of Michigan's July reading of consumer sentiment. The
mid-July overall figure fell to 64.6 which was its lowest level since
March. Consensus expectations had been for a reading of 71.0. During
the last ten years, there has been a 61% correlation between the level
of sentiment and the growth in real spending during the next five
months.
The expectations component of the index deteriorated the most. It posted a 12.0% m/m decline though it still was up y/y. Expectations for personal finances fell sharply with lower stock prices. Expected business conditions during the next five years also fell sharply to the lowest level since March and expectations for conditions during the next year fell to the lowest since April.
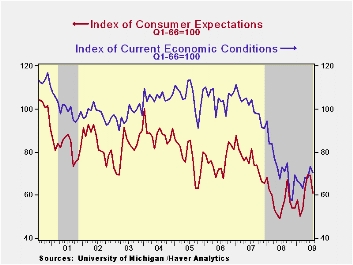 The
current economic
conditions gave back roughly half of its improvement during June. The
decline was led by a reversal of last month's rise in the index of
current buying conditions for large household goods. The reading of
current personal finances surprisingly rose, perhaps due to less debt,
and now it has returned to the April level.
The
current economic
conditions gave back roughly half of its improvement during June. The
decline was led by a reversal of last month's rise in the index of
current buying conditions for large household goods. The reading of
current personal finances surprisingly rose, perhaps due to less debt,
and now it has returned to the April level.
The opinion of government policy, which may eventually influence economic expectations, fell for the second month to its lowest level since February. An increased 33% of respondents thought that a poor job was being done by government while a reduced 25% thought that a good job was being done
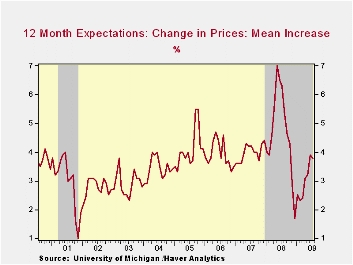 Inflation
expectations for the next year held roughly stable at 3.8%. That
compares to a low of 1.7% last December but remained down from a
reading which was as high as 7.0% last May.
Inflation
expectations for the next year held roughly stable at 3.8%. That
compares to a low of 1.7% last December but remained down from a
reading which was as high as 7.0% last May.
The University of Michigan survey data is not seasonally adjusted. The reading is based on telephone interviews with about 500 households at month-end; the mid-month results are based on about 300 interviews. The summary indexes are in Haver's USECON database with details in the proprietary UMSCA database.
| University of Michigan | Mid-July | June | May | July y/y | 2008 | 2007 | 2006 |
|---|---|---|---|---|---|---|---|
| Consumer Sentiment | 64.6 | 70.8 | 68.7 | 5.6% | 63.8 | 85.6 | 87.3 |
| Current Conditions | 70.4 | 73.2 | 67.7 | -3.7 | 73.7 | 101.2 | 105.1 |
| Expectations | 60.9 | 69.2 | 69.4 | 13.8 | 57.3 | 75.6 | 75.9 |

Tom Moeller
AuthorMore in Author Profile »Prior to joining Haver Analytics in 2000, Mr. Moeller worked as the Economist at Chancellor Capital Management from 1985 to 1999. There, he developed comprehensive economic forecasts and interpreted economic data for equity and fixed income portfolio managers. Also at Chancellor, Mr. Moeller worked as an equity analyst and was responsible for researching and rating companies in the economically sensitive automobile and housing industries for investment in Chancellor’s equity portfolio. Prior to joining Chancellor, Mr. Moeller was an Economist at Citibank from 1979 to 1984. He also analyzed pricing behavior in the metals industry for the Council on Wage and Price Stability in Washington, D.C. In 1999, Mr. Moeller received the award for most accurate forecast from the Forecasters' Club of New York. From 1990 to 1992 he was President of the New York Association for Business Economists. Mr. Moeller earned an M.B.A. in Finance from Fordham University, where he graduated in 1987. He holds a Bachelor of Arts in Economics from George Washington University.