Global| Jun 08 2007
U.S. Trade Deficit Shrinks Real Exports Outpace Real Imports
Summary
Lest the headline give you any misinformation let me point out that the US trade deficit is a nominal phenomenon and nominal exports did also outpace nominal imports. That is a necessary but not a sufficient condition to shrink the [...]
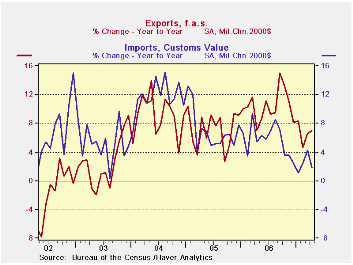
Lest the headline give you any misinformation let me point out that the US trade deficit is a nominal phenomenon and nominal exports did also outpace nominal imports. That is a necessary but not a sufficient condition to shrink the overall trade deficit in the US. Exports rose by 0.2% in April as imports sank by 1.9% as the bulk of the drop was outside of the petroleum complex of goods.
Dropping imports is not a good sign for growth since imports tend to grow/shrink at twice the pace of GDP growth. Still imports also contain goods destined for inventories since so many consumer goods are imports and this may be a sign that the inventory cycle has not yet kicked up. That could mean that as of April inventories are still in a corrective phase and that they will not add to GDP or, not add much to 2007Q2 GDP.
At 2% real import growth suggests GDP growth of 1% or less – but the new quarter is young.
Exports are less than 60% the size of imports (inverse ratio is nearly 1.75). That means that exports must grow by 1.75 times faster than nominal imports just to keep the nominal trade deficit from getting larger. While real exports are outpacing real imports and will augment REAL GDP the condition necessary for the nominal deficit to contract is a bit stronger: exports must grow by 1.75 times faster than imports. And over the past year or so that condition has been fulfilled. The deficit over the last 12 months has averaged -$61.81 while the deficit in April is a smaller -$58.50. The slowdown in US GDP has imparted a slowing to imports as import growth diminished to 4.8% Y/Y while exports grew by 10.7% Yr/Yr. However, recently exports have slowed and nonpetroleum imports have slowed as well (see table below).
US trade trends are complex but telling. OPEC’s own imports have slowed recently as oil prices had hit a plateau then fallen. But more recently yet, oil prices are on the rise and with it so will OPEC imports pick up again. This should mean that US exports to OPEC that had slowed will pick up as well even as higher oil prices bloat the US import total.
US exports to China have slowed marked in early 2007 (no exhibit). In April Yr/Yr US exports to China ranked seventh out of nine since 1999. The Y/Y growth of exports to China is down to 12% in April after growing by 25% or more in each of the previous four 12-month periods ending in April. Earlier, US export figures for Jan-March show the same sort of gap with earlier years, except that Jan-March trade flows were very weak in comparison with this year as short a period ago as 2005. Early year weakness does not doom the trend for the year necessarily. But the weakness is a bit disconcerting and there is no guarantee of a reversal - still I think there is a likelihood that these exports to China will revive.
China has been trying to slow but without much success. Rather than taking weak US exports to China as evidence of China slowing, it may be evidence of US slowing since there is also a good deal of round trip value-added trading between China and the US. Yr/Y US imports from China dropped to their lowest growth rate in NINE years in April at 2.7% Y/Y.
New trends show that: Technology exports and imports have slowed. Also oil prices at the time of import are now nearly the same as they have averaged over the past year: $57.29/bbl now compared to an average of $57.70/bbl.
On the good news front: US exports to Japan received a boost in April. Their Yr/Yr growth rate ran up to 16.5% in April from 6.2% in March. A part of this is the favorable year ago comparison, however, as US exports to Japan fell by 2.6% Y/Y in April of 2006. Even so, US exports to Japan show more resilience even if they are at a lower growth rate that US exports to China or to the Asia NICs where Yr/Yr the growth rate of US export flows is dropping sharply.
On balance there has been a slowing in US trade flows as the US economy has slowed. For a while it looked as though trade was confirming the domestic slowdown signals and that such signals could accumulate and become worrisome. But US employment growth has picked up and the inventory cycle seems to be winding itself down and in that context these slowing flows may simply be the lagged effects of that slowdown that seems to be transitioning into growth. Trade flows do lag. But we must remember that as much as US imports are tied to US growth, so US growth is still an important stimulant for global growth. The US and its hated deficit has been an engine of growth for the rest of the world; that role was reduced in the past year when the nominal US deficit actually shrank and that may have contributed to slower global growth.
The OECD leading indicators (released today) show that growth in the US is on an upswing and points to still solid trends in China (albeit through March not April). Germany, Italy and Japan are flagged as slowing in the OECD framework though US exports to Japan seem to be a reason to cast some of those fears aside there.
Trade, after having taken a big bite out of Q1 GDP seems to have become a mild positive for the US economy. Of course, a good deal of the reason for trade’s more moderate role has been the slowing in US growth itself. Trade is one of the automatic stabilizers you may recall from your econ 101 studies. As the economy picks up trade will likely become more of a negative again, although probably by less than before because the US growth potential now seems lower. That will make imports slower and reduce their ‘feedback’ drag on growth. The outlook for US exports, is, however, still questionable. There are again some scattered signs of slowing in Europe but mostly from Germany and they are new, scattered, and not pronounced, so far. Our best guess is that trade’s drag is not going to be reduced and that If European growth lives up to its forecasts trade could continue to be a positive for growth in the US.
| Category | Current | Previous | $SA % SAAR/Average | ||
| % M/M: Current & Prev | |||||
| Apr.07 | M:$Bil/% | M:$Bil/% | 3-MO | 6-MO | Yr/Yr |
| Goods & Services Balance | -$58.50 | -$62.39 | -$59.49 | -$59.01 | -$61.81 |
| Goods Balance | -$67.08 | -$70.74 | -$67.77 | -$67.13 | -$69.16 |
| Exports (G&S) | 0.2% | 2.6% | 5.5% | 8.0% | 10.9% |
| Merchandise | 0.1% | 2.8% | 2.8% | 6.7% | 10.7% |
| Services | 0.5% | 2.2% | 12.3% | 11.1% | 11.5% |
| Imports (G&S) | -1.9% | 4.4% | 7.6% | 5.8% | 5.0% |
| Merchandise | -2.2% | 5.0% | 8.2% | 5.9% | 4.8% |
| Non-Petrol | -2.4% | 2.2% | 7.4% | 1.3% | 4.5% |
| Petrol & Product | -0.2% | 18.4% | 1.6% | 29.9% | 4.0% |
| Services | -0.1% | 1.3% | 4.7% | 5.0% | 5.8% |
| Technology Trade | |||||
| Tech Exports | -14.7% | 24.6% | -4.0% | -14.4% | 4.2% |
| Tech Imports | -6.4% | 14.9% | -2.5% | -13.4% | 17.8% |
| Crude Oil | |||||
| MBD (Volume):Mb/d | 10.16 | 10.46 | 9.88 | 9.90 | 10.22 |
| $/BBL | $57.28 | $53.00 | $53.66 | $53.21 | $57.70 |
| Non Petroleum trade | |||||
| Exports | -0.1% | 3.1% | 3.0% | 7.9% | 11.5% |
| Imports | -2.4% | 2.2% | 7.4% | 1.3% | 4.5% |
| Balance | -$42.29 | -$45.51 | -$44.38 | -$43.96 | -$44.82 |
| Real Exports and Imports: Non-Petroleum trade | |||||
| Real Non Oil Exports | -0.3% | 3.6% | 1.2% | 3.6% | 7.3% |
| Real Non Oil Imports | -2.6% | 2.1% | 6.2% | -1.7% | 1.8% |
| Balances are in Bil averages for period: Others % annualized except monthly | |||||
by Carol Stone June 8, 2007
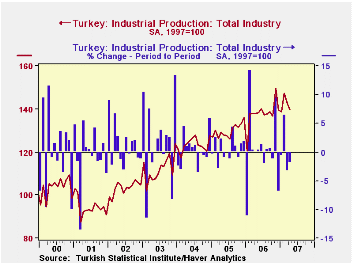
Industrial production in Turkey has declined in the last two reported months, but those follow a very strong performance in February. In total, IP dropped 1.9% and 3.4% in April and March, respectively, while it surged 6.4% in February. Total manufacturing output fell 3.0% in April and 3.9% in March, but February was up 7.5%. These are all month-to-month figures, seasonally adjusted by Haver Analytics. Data on Turkey are included in Haver's EMERGEMA database, with the Middle Eastern and African nations.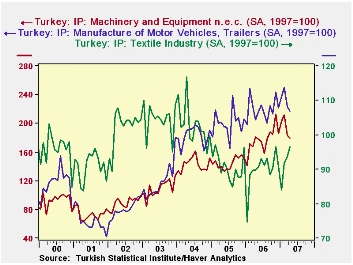
As is evident from just the moves in the totals, Turkish industry behavior is not very smooth. Even the mature textile sector -- from the traditional rugs to high fashion, for instance -- has been growing recently, but fell hard in 2005. Newer sectors are more erratic still. Machinery production was down 2.8% in April and 13.1% in March, but it had surged by 22% during 2006.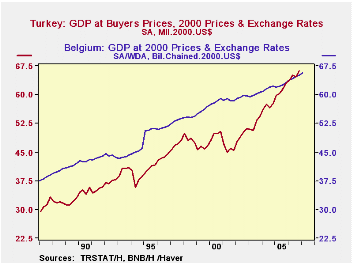
This said, the economy is a diverse one, with the traditional textiles now joined by a wide array of other sectors. Metals and machinery are notable as well as automobile production. Indeed, the auto and truck output have expanded rapidly, with a pace now of about 50,000 cars monthly and 30,000 trucks. The truck figures rival Germany and France and exceed the UK. [Those countries' auto and truck output volumes are in Haver's G10+ database.] The diversity, of course, helps limit the lurches in total industrial production as strength in one sector can balance weakness elsewhere. And the Turkish economy as a whole is moving ahead. Its US-dollar equivalent GDP in 2000 prices was as large last year as those of Austria, Belgium and Switzerland and it is rapidly gaining on Sweden, all much more established. Of course, the standard of living of the average Turk remains a mere fraction of Belgians, Austrians and Swiss. But the growth is encouraging.
| TURKEY Industrial Production ( % Change) |
Apr 2007* | Mar 2007* | Feb 2007* | 2006 | 2005 | 2004 | 2000- 2003 |
|---|---|---|---|---|---|---|---|
| Total Industry | -1.9 | -3.4 | 6.4 | 5.8 | 5.4 | 9.8 | 2.8 |
| Manufacturing | -3.0 | -3.9 | 7.5 | 5.5 | 4.8 | 10.4 | 3.2 |
| Textiles | 3.0 | 2.0 | 9.4 | -1.1 | -11.8 | -1.5 | 2.9 |
| Basic Metals | 1.6 | -1.0 | 3.9 | 10.7 | 3.4 | 11.6 | 5.4 |
| Machinery | -2.8 | -13.1 | 4.4 | 22.0 | 1.2 | 31.0 | 5.7 |
| Motor Vehicles | -3.0 | -10.3 | 5.2 | 9.7 | 9.6 | 53.3 | 0.9 |
by Robert Brusca June 8, 2007
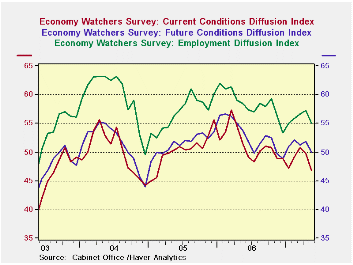
Japan’s economy watcher’s survey cycled higher from late 2004 through early 2005. Then it dropped off until picking up to a minor peak in August 2006. From that mini- peak it spread out on a gradual increase until it fell sharply again in May, the figure reported today – a sharp drop.
The employment and future indexes are cycling in concert but with smaller amplitudes.
The Teikoku indexes and NTC MFG survey echo the findings of weakness but the various surveys find weakness in differing magnitudes. See table below.
The far right columns put the recent observations for each index or sub-reading in the context of its five year max or min. This allows us to compared intrinsically different indicators.
Results show that the NTC MFG index is the weakest in the 30th percentile of its range for this period. Next in line comes the economy watcher index and its components with the headline index at 44.4% of its range. The Teikoku indices are the strongest with MFG relatively firm at a range reading of 75% (top 25% of its range) and with retail the relative weakest at 64% of its range. Wholesale services and construction are relatively healthy in the Teikoku scheme. Even so the Teikoku indices are dropping and all sectors dropped again in May. They made their local peak about one year and have been slipping slowly ever since.
| Raw readings of each survey | Percent of 5Yr range* | ||||||
| May-07 | Apr-07 | Mar-07 | Feb-07 | May-07 | Apr-07 | Mar-07 | |
| Diffusion | |||||||
| Economy Watchers | 46.8 | 49.7 | 50.8 | 49.2 | 44.4% | 59.8% | 65.6% |
| Employment | 50.7 | 57.1 | 56.3 | 55.9 | 35.6% | 63.1% | 59.7% |
| Future | 50.0 | 51.9 | 51.3 | 52.1 | 52.9% | 68.0% | 70.6% |
| NTC MFG | 51.4 | 52.3 | -- | -- | 30.2% | 41.4% | 43.5% |
| Econ Trends (Teikoku'/50 neutral/weighted diffusion) | |||||||
| MFG | 45.2 | 47.0 | 47.2 | 46.7 | 76.2% | 85.1% | 86.2% |
| Retail | 39.6 | 41.1 | 41.1 | 39.9 | 64.3% | 74.3% | 74.3% |
| Wholesale | 42.8 | 44.3 | 44.6 | 43.8 | 75.6% | 83.5% | 85.8% |
| Services | 49.1 | 50.3 | 49.9 | 49.4 | 88.4% | 93.6% | 92.2% |
| Construction | 37.7 | 38.4 | 38.7 | 38.7 | 84.4% | 89.2% | 91.2% |
| 100 is high; Zero is low | |||||||

Robert Brusca
AuthorMore in Author Profile »Robert A. Brusca is Chief Economist of Fact and Opinion Economics, a consulting firm he founded in Manhattan. He has been an economist on Wall Street for over 25 years. He has visited central banking and large institutional clients in over 30 countries in his career as an economist. Mr. Brusca was a Divisional Research Chief at the Federal Reserve Bank of NY (Chief of the International Financial markets Division), a Fed Watcher at Irving Trust and Chief Economist at Nikko Securities International. He is widely quoted and appears in various media. Mr. Brusca holds an MA and Ph.D. in economics from Michigan State University and a BA in Economics from the University of Michigan. His research pursues his strong interests in non aligned policy economics as well as international economics. FAO Economics’ research targets investors to assist them in making better investment decisions in stocks, bonds and in a variety of international assets. The company does not manage money and has no conflicts in giving economic advice.
More Economy in Brief