 Global| Dec 11 2008
U.S. Trade Deficit Rose As Exports Fell
by:Tom Moeller
|in:Economy in Brief
Summary
The October U.S. foreign trade deficit rose unexpectedly. The modest rise to $57.2B from a little revised $56.6B during September contrasted with Consensus expectations for a narrowing to $53.5B. So far this year the monthly trade [...]
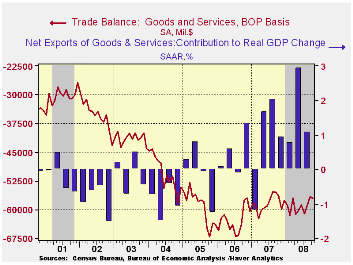
The October U.S. foreign trade deficit rose unexpectedly. The modest rise to $57.2B from a little revised $56.6B during September contrasted with Consensus expectations for a narrowing to $53.5B. So far this year the monthly trade deficit has averaged $59.1B, slightly deeper than the $58.3B averaged during the first ten months of 2007.
Adjusted for price inflation the trade deficit in goods deepened to $46.4B from a revised September level of $42.0B which was larger than originally reported. Nevertheless, year-to-date the real deficit narrowed more than $10.0B versus 2007 to an average $44.9B as real exports surged 9.0% and real imports fell 2.1%. A narrower trade deficit was estimated to have added 1.1 percentage points to real GDP growth last quarter following a 2.9 point addition during 2Q.
Developing recessions in economies abroad lowered U.S. exports for the third consecutive month. The 2.2% decline followed a 6.4% September drop that was slightly deeper than initially reported. The decline reflected a 2.8% drop in goods exports following the 8.5% September decline. Nevertheless, the increase in the competiveness of U.S.-made products due to past declines in the U.S. dollar lifted exports by 4.4% y/y. Adjusted for prices, chained-dollar goods exports slipped 0.9% (+0.7% y/y) after a slightly revised 8.2% September decline. Real exports of capital goods slipped 0.6% (-3.6% y/y) after a 9.6% plunge during the prior month. Exports of nonauto consumer goods fell 1.4% (+3.8% y/y) for the third consecutive monthly drop. Real exports of automobiles & parts fell 2.7% (-5.2% y/y) and real exports of foods, feeds & beverages slipped 0.4% (+1.5% y/y).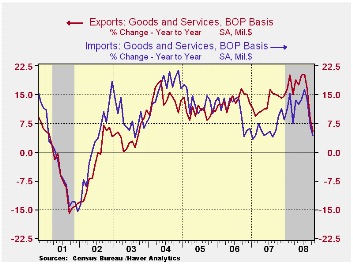
Nominal exports of services slipped 0.7% (+7.3% y/y) as travel exports fell. Though they fell hard for the second month, travel exports remained up 7.2% y/y. Passenger fares fell another 1.8% but remained up 15.3% y/y. That y/y gain was, however, half that of several months ago. Exports of "other" private services slipped 0.4% as year-to-year growth fell to 5.4% after an 18.2% gain during all of last year.
Despite the developing U.S. recession, petroleum imports rose 3.0% and they surged a surprising 20.8% in constant dollar terms. The gain was driven by a 22.0% m/m surge in the quantity of petroleum products imported. The quantity of crude petroleum imports jumped 28.0% (2.9% y/y) and that nearly recovered declines during the prior two months. The average price per barrel of crude oil fell to $92.02 (+26.8% y/y) from a high of $124.7 in July. 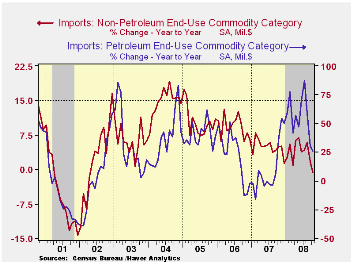
Recessionary forces were clearly evident in the 2.3% decline in the value of nonpetroleum imports. Measured in chained 2000 dollars, nonoil imports fell 1.6% (-4.9% y/y), though real imports of nonauto consumer goods rose 1.0% (-1.1% y/y) following a 7.7% decline during September. The chained-dollar value of imports of automotive vehicles & parts fell another 5.2% (-22.8% y/y) and real imports of nonauto capital goods fell 3.7% (-2.4% y/y).
Services imports were unchanged (+6.0% y/y) after the 3.5% September drop. Travel imports ticked up 0.2% (0.4% y/y) after the 4.6% September drop. Passenger fares rose 2.3% (11.8% y/y). That annual gain is half what it was earlier this year.
The U.S. trade deficit in goods with China deepened slightly to another record $28.0B. Exports to China made up for the prior month's shortfall and rose 14.1% (6.8% y/y) after 18.2% growth during all of last year. Imports rose 2.8% (7.8% y/y). That y/y growth is down sharply, with the weakening U.S. economy, from 20% to 30% rates of growth during the prior ten years. The trade deficit with Japan deepened again m/m to $6.0B but during the first ten months of this year it is down to average of $6.2B from an average $6.9B during the first ten months of last year. The trade deficit with Japan ranged between $5 and $8 billion between 2003 and 2007.
| Foreign Trade | October | September | Y/Y | 2007 | 2006 | 2005 |
|---|---|---|---|---|---|---|
| U.S. Trade Deficit | $57.2B | $56.6B | $56.3B (10/07) | $700.3 | $753.3 | $711.6B |
| Exports - Goods & Services | -2.2% | -6.4% | 5.3% | 13.0% | 13.5% | 10.6% |
| Imports - Goods & Services | -1.3% | -5.7% | 4.2% | 6.1% | 10.8% | 12.8% |
| Petroleum | 3.0% | -16.7% | 25.7% | 9.4% | 20.1% | 39.6% |
| Nonpetroleum Goods | -2.3% | -3.5% | -0.8% | 4.8% | 9.1% | 10.3% |

Tom Moeller
AuthorMore in Author Profile »Prior to joining Haver Analytics in 2000, Mr. Moeller worked as the Economist at Chancellor Capital Management from 1985 to 1999. There, he developed comprehensive economic forecasts and interpreted economic data for equity and fixed income portfolio managers. Also at Chancellor, Mr. Moeller worked as an equity analyst and was responsible for researching and rating companies in the economically sensitive automobile and housing industries for investment in Chancellor’s equity portfolio. Prior to joining Chancellor, Mr. Moeller was an Economist at Citibank from 1979 to 1984. He also analyzed pricing behavior in the metals industry for the Council on Wage and Price Stability in Washington, D.C. In 1999, Mr. Moeller received the award for most accurate forecast from the Forecasters' Club of New York. From 1990 to 1992 he was President of the New York Association for Business Economists. Mr. Moeller earned an M.B.A. in Finance from Fordham University, where he graduated in 1987. He holds a Bachelor of Arts in Economics from George Washington University.
More Economy in Brief


