 Global| Dec 11 2008
U.S. Trade Deficit Rose As Exports Fell
by:Tom Moeller
|in:Economy in Brief
Summary
The October U.S. foreign trade deficit rose unexpectedly. The modest rise to $57.2B from a little revised $56.6B during September contrasted with Consensus expectations for a narrowing to $53.5B. So far this year the monthly trade [...]
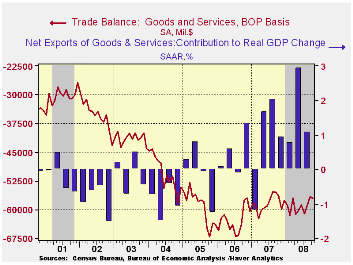
The October U.S. foreign trade deficit rose unexpectedly. The modest rise to $57.2B from a little revised $56.6B during September contrasted with Consensus expectations for a narrowing to $53.5B. So far this year the monthly trade deficit has averaged $59.1B, slightly deeper than the $58.3B averaged during the first ten months of 2007.
Adjusted for price inflation the trade deficit in goods deepened to $46.4B from a revised September level of $42.0B which was larger than originally reported. Nevertheless, year-to-date the real deficit narrowed more than $10.0B versus 2007 to an average $44.9B as real exports surged 9.0% and real imports fell 2.1%. A narrower trade deficit was estimated to have added 1.1 percentage points to real GDP growth last quarter following a 2.9 point addition during 2Q.
Developing recessions in economies abroad lowered U.S. exports
for
the third consecutive month. The 2.2% decline followed a 6.4% September
drop that was slightly deeper than initially reported. The decline
reflected a 2.8% drop in goods exports following the 8.5% September
decline. Nevertheless, the increase in the competiveness of U.S.-made
products due to past declines in the U.S. dollar lifted exports by 4.4%
y/y. Adjusted for prices, chained-dollar goods exports slipped 0.9%
(+0.7% y/y) after a slightly revised 8.2% September decline. Real
exports of capital goods slipped 0.6% (-3.6% y/y) after a 9.6% plunge
during the prior month. Exports of nonauto consumer goods fell 1.4%
(+3.8% y/y) for the third consecutive monthly drop. Real exports of
automobiles & parts fell 2.7% (-5.2% y/y) and real exports of
foods, feeds & beverages slipped 0.4% (+1.5% y/y).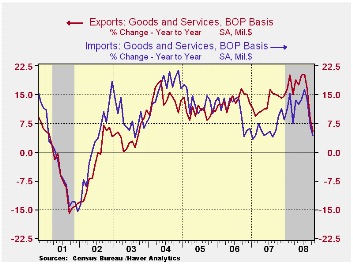
Nominal exports of services slipped 0.7% (+7.3% y/y) as travel exports fell. Though they fell hard for the second month, travel exports remained up 7.2% y/y. Passenger fares fell another 1.8% but remained up 15.3% y/y. That y/y gain was, however, half that of several months ago. Exports of "other" private services slipped 0.4% as year-to-year growth fell to 5.4% after an 18.2% gain during all of last year.
Despite the developing U.S. recession, petroleum imports rose
3.0%
and they surged a surprising 20.8% in constant dollar terms. The gain
was driven by a 22.0% m/m surge in the quantity of petroleum products
imported. The quantity of crude petroleum imports jumped 28.0% (2.9%
y/y) and that nearly recovered declines during the prior two months.
The average price per barrel of crude oil fell to $92.02 (+26.8% y/y)
from a high of $124.7 in July. 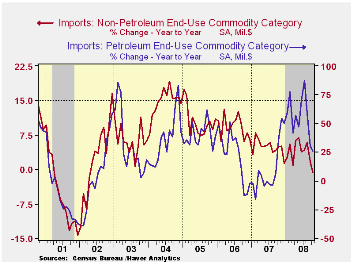
Recessionary forces were clearly evident in the 2.3% decline in the value of nonpetroleum imports. Measured in chained 2000 dollars, nonoil imports fell 1.6% (-4.9% y/y), though real imports of nonauto consumer goods rose 1.0% (-1.1% y/y) following a 7.7% decline during September. The chained-dollar value of imports of automotive vehicles & parts fell another 5.2% (-22.8% y/y) and real imports of nonauto capital goods fell 3.7% (-2.4% y/y).
Services imports were unchanged (+6.0% y/y) after the 3.5% September drop. Travel imports ticked up 0.2% (0.4% y/y) after the 4.6% September drop. Passenger fares rose 2.3% (11.8% y/y). That annual gain is half what it was earlier this year.
The U.S. trade deficit in goods with China deepened slightly to another record $28.0B. Exports to China made up for the prior month's shortfall and rose 14.1% (6.8% y/y) after 18.2% growth during all of last year. Imports rose 2.8% (7.8% y/y). That y/y growth is down sharply, with the weakening U.S. economy, from 20% to 30% rates of growth during the prior ten years. The trade deficit with Japan deepened again m/m to $6.0B but during the first ten months of this year it is down to average of $6.2B from an average $6.9B during the first ten months of last year. The trade deficit with Japan ranged between $5 and $8 billion between 2003 and 2007.
| Foreign Trade | October | September | Y/Y | 2007 | 2006 | 2005 |
|---|---|---|---|---|---|---|
| U.S. Trade Deficit | $57.2B | $56.6B | $56.3B (10/07) | $700.3 | $753.3 | $711.6B |
| Exports - Goods & Services | -2.2% | -6.4% | 5.3% | 13.0% | 13.5% | 10.6% |
| Imports - Goods & Services | -1.3% | -5.7% | 4.2% | 6.1% | 10.8% | 12.8% |
| Petroleum | 3.0% | -16.7% | 25.7% | 9.4% | 20.1% | 39.6% |
| Nonpetroleum Goods | -2.3% | -3.5% | -0.8% | 4.8% | 9.1% | 10.3% |
by Tom Moeller December 11, 2008
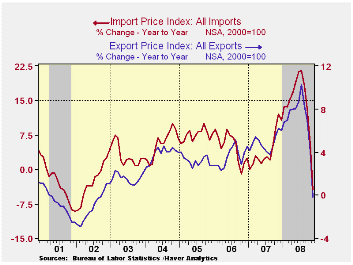
Total U.S. import prices declined another 6.7% last month after the revised 5.4% drop during October. Consensus expectations had been for a 4.8% November decline.
Petroleum prices were off sharply again by 25.8% and this month imported crude petroleum prices are down another 20% m/m.
November import prices less petroleum doubled their decline of October and fell 1.8%. During the last three months prices fell at a 13.2% annual rate versus the 12%-to-13% rates of positive growth this past spring.
Growth
in import prices will slow further given the recent rise in the foreign
exchange value of the dollar. During
the last ten years there has been an 83% (negative) correlation between
the nominal trade-weighted exchange value of the US dollar vs. major
currencies and the y/y change in non oil import prices.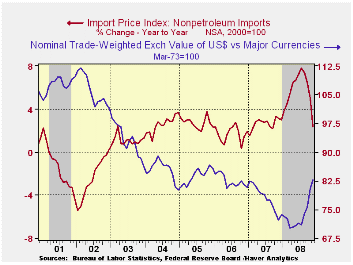
Capital goods import prices fell 0.4%. On a three-month basis prices fell at a 2.5% annual rate after a 5%-to-6% rate of increase earlier this year. Less the lower prices of computers, capital goods prices also fell 0.4% and the three-month growth went to a negative 1.4% after 9.0% growth earlier this year. Prices of computers, peripherals & accessories were down at a 6.8% rate during the last three months.
Prices for nonauto consumer goods fell 0.3%. The rate of increase during the last three months went to a negative 1.1% versus the 5.9% peak earlier this year. Durable goods prices overall rose were unchanged during the last three months versus a 6.2% rate of increase earlier this year.
Total export prices fell 3.2% due to a 7.0% (-2.8% y/y) decline in agricultural prices. Nonagricultural export prices also fell by 2.9% and they were unchanged y/y. It was the fourth consecutive monthly decline.
| Import/Export Prices (NSA, %) | November | October | Y/Y | 2007 | 2006 | 2005 |
|---|---|---|---|---|---|---|
| Import - All Commodities | -6.7 | -5.4 | -4.4 | 4.2 | 4.9 | 7.5 |
| Petroleum | -25.8 | -19.8 | -29.0 | 11.6 | 20.6 | 37.6 |
| Non-petroleum | -1.8 | -0.9 | 2.4 | 2.7 | 1.7 | 2.7 |
| Export- All Commodities | -3.2 | -2.0 | -0.2 | 4.9 | 3.6 | 3.2 |
by Tom Moeller December 11, 2008
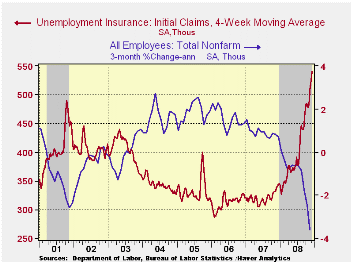
Initial claims for unemployment insurance jumped last week. The 58,000 surge to 573,000 brought them to the highest level since November, 1982 when initial filings hit 612,000. This month claims are 8.9% higher than the November average.
Expectations had been for claims last week of 523,000. The
four-week
moving average of initial claims rose to this cycle's high of 540,500
(59.1% y/y).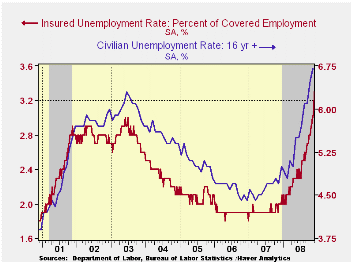
The largest increases in initial claims for the week ending Nov. 29 were in Wisconsin (+16,331), Iowa (+6,240), Arkansas (+1,509), Mississippi (+1,398), and North Dakota (+1,391), while the largest decreases were in California (-20,304), Florida (-8,626), Missouri (-8,347), Michigan (-7,323), and Texas (-7,129).
Continuing claims for unemployment insurance during the week of November 29 surged by 338,000, also to the highest level since 1982. The four-week average of continuing claims rose to 4,133,500. Continuing claims provide some indication of workers' ability to find employment and they lag the initial claims figures by one week.
The insured rate of unemployment rose to a new cycle high of 3.3%. The Commerce Department indicated the highest insured unemployment rates in the week ending November 22 were in Puerto Rico (5.0 percent), Oregon (4.5), Michigan (4.3), Nevada (4.1), Idaho (3.9), Alaska (3.8), Pennsylvania (3.7), South Carolina (3.7), New Jersey (3.6), and Wisconsin (3.5).
| Unemployment Insurance (000s) | 12/06/08 | 11/29/08 | 11/22/08 | Y/Y | 2007 | 2006 | 2005 |
|---|---|---|---|---|---|---|---|
| Initial Claims | 573 | 515 | 531 | 70.0% | 322 | 313 | 331 |
| Continuing Claims | -- | 4,429 | 4,091 | 67.6% | 2,552 | 2,459 | 2,662 |
by Tom Moeller December 11, 2008
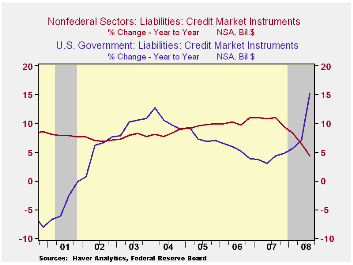
After the sharp decline during the second quarter, the U.S. household and business sectors pulled back their borrowing further during 3Q. It was only the Federal government that kept the credit houses in business. Nongovernment liabilities grew just 0.2% last quarter. A record low that pulled the y/y growth back to 4.3%, a rate not seen in fifteen years.
Borrowing by the household sector, like during 2Q, nearly
evaporated
as it posted a 0.1% uptick. Consumer credit did rise 1.4% (3.5% y/y)
but that was offset by a 0.4% decline (+2.4% y/y) in mortgage
borrowing. Households' obligations on home mortgages in fact declined
by an unheard of $61B, or 0.5% (+1.2% y/y) after the $9B 2Q shortfall.
Consumers' other credit liabilities rose $35B (3.5% y/y). Growth in
bank loans remained fairly steady at 16% y/y).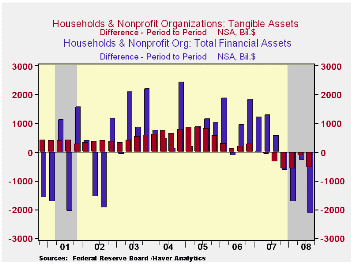
As economic recession developed and the war in the Middle East continued, the federal government's debt obligations surged an unprecedented $527B or by 15.3% y/y.
Credit market debt owed by the financial sector remained strong and steady at a 7% growth rate. Liabilities at commercial banks surged 23.4% y/y while savings institutions liabilities fell by 8.1%.
Asset price implosion also was in evidence in the 3Q figures. The value of equity market shares fell by nearly $1 trillion (-27.3% y/y) and mutual fund share values fell $597B or 17.5% y/y. Pension fund reserves additionally were hit to the tune of $600B or 12.5% y/y).
As a result of the implosion in equity market and home prices, the net worth of the U.S. household sector last quarter deteriorated by nearly three trillion dollars from the prior quarter's level. The dollar level of household sector financial assets fell $2.1 trillion (-9.6% y/y) and tangible asset values fell $0.5 trillion (-6.6% y/y).That pulled the net-wealth lost since the year-ago peak to $7.1 trillion, or 11.1%.
| Flow of Funds (Y/Y % Chg.) | % of Total | 3Q '08 | 2Q'08 | 2007 | 2006 | 2005 |
|---|---|---|---|---|---|---|
| Total Credit Market Debt Outstanding | -- | 6.2 | 7.6 | 10.1 | 9.9 | 9.2 |
| Federal Government | 11% | 15.3 | 7.0 | 4.9 | 3.9 | 7.0 |
| Households | 28% | 2.2 | 4.0 | 6.8 | 10.2 | 11.1 |
| Nonfinancial Corporate Business | 13% | 6.9 | 9.4 | 13.3 | 8.5 | 6.4 |
| Nonfarm, NonCorporate Business | 7% | 7.6 | 11.3 | 13.1 | 14.7 | 13.6 |
| Financial Sectors | 32% | 7.3 | 9.8 | 13.2 | 10.0 | 8.9 |
| Net Worth: Households & Nonprofit Organizations (Trillions) | -- | $56.540 | $59.354 | $62.170 | $61.591 | $57.385 |
| Tangible Assets: Households | -- | $25.842 | $26.381 | $27.092 | $28.061 | $27.125 |
| Financial Assets: Households | -- | $45.271 | $47.419 | $49.457 | $46.984 | $42.441 |
by By: Robert Brusca December 11, 2008
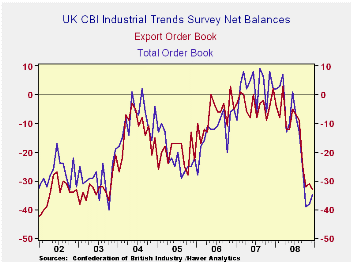
The chart above tells the story for UK manufacturing. The bottom fell out in Sept, then in Oct and Nov., things got worse and now negative conditions are remaining in force at levels near the bottom of their recent range. Orders stand in the 4th percentile of their range (since 2000); they remain very weak. The volume index for the outlook is at a raw reading of -42, the lowest since 2000. On a broader front going back to 1988 the volume outlook index has been weaker than this only 3% of the time. Stocks are at the top of their range since 2000 but the same stocks number is in the top 9% of the data going back to 1988 – inventories by any comparison are top-heavy.
The orders and export order weakness also look low in broader comparisons. Orders are weaker than this only 15% of the time and foreign orders are weaker 26% of the time in data going back to 1988.
To combat weakness The UK has embarked on a stimulus plan. That plan came under attack today from German Finance Minister Steinbruck who characterized British stimulus as ‘breathtaking’ calling it ‘crass Keynesianism.’ In France , economy minister Lagarde was urging the EU to do more to stimulate the region as she warned that the slowdown could get much more severe. Lagarde says France is working and Germany is thinking, pointing out that different countries have different approaches while being much less confrontational than Steinbruck overall. In this environment it is Germany that is doing so much less and it is Germany that is the outlier much more than the UK .
| UK Industrial volume data CBI Survey | ||||||||||
|---|---|---|---|---|---|---|---|---|---|---|
| Reported: | Dec 08 |
Nov 08 |
Oct 08 |
Sep 08 |
Aug 08 |
12MO Avg | Pcntle | Max | Min | Range |
| Total Orders | -35 | -38 | -39 | -26 | -13 | -9 | 4% | 9 | -40 | 49 |
| Export Orders | -33 | -31 | -32 | -25 | -9 | -10 | 17% | 3 | -38 | 41 |
| Stocks:FinGds | 21 | 25 | 24 | 21 | 18 | 14 | 100% | 25 | -2 | 27 |
| Looking ahead | ||||||||||
| Output Volume:Nxt 3M | -42 | -42 | -31 | -16 | -13 | -2 | 0% | 28 | -42 | 70 |
| Avg Prices 4Nxt 3m | 0 | 10 | 23 | 31 | 34 | 24 | 55% | 34 | -19 | 53 |
| From end 2000 | ||||||||||

Tom Moeller
AuthorMore in Author Profile »Prior to joining Haver Analytics in 2000, Mr. Moeller worked as the Economist at Chancellor Capital Management from 1985 to 1999. There, he developed comprehensive economic forecasts and interpreted economic data for equity and fixed income portfolio managers. Also at Chancellor, Mr. Moeller worked as an equity analyst and was responsible for researching and rating companies in the economically sensitive automobile and housing industries for investment in Chancellor’s equity portfolio. Prior to joining Chancellor, Mr. Moeller was an Economist at Citibank from 1979 to 1984. He also analyzed pricing behavior in the metals industry for the Council on Wage and Price Stability in Washington, D.C. In 1999, Mr. Moeller received the award for most accurate forecast from the Forecasters' Club of New York. From 1990 to 1992 he was President of the New York Association for Business Economists. Mr. Moeller earned an M.B.A. in Finance from Fordham University, where he graduated in 1987. He holds a Bachelor of Arts in Economics from George Washington University.
More Economy in Brief


