 Global| Aug 12 2009
U.S. Trade Deficit Remains NearThe Narrowest Since 2001
by:Tom Moeller
|in:Economy in Brief
Summary
As the U.S. recession continued, the foreign trade deficit remained near its narrowest level 2001. The deficit of $27.0B was just slightly deeper than the unrevised May level of $26.0B. Consensus expectations had been for a deficit of [...]
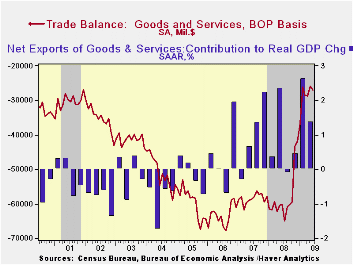
As the U.S. recession continued, the foreign trade deficit remained near its narrowest level 2001. The deficit of $27.0B was just slightly deeper than the unrevised May level of $26.0B. Consensus expectations had been for a deficit of $28.5B. Higher petroleum imports have been the main source of upward pressure on the trade deficit recently. Higher crude oil prices raised them by more than one-quarter during June and by 12.2% so far this year. Offsetting that increase was the U.S. recession which caused June nonpetroleum imports to fall by 1.0%. That pulled their decline so far this year to 15.7%. Higher exports were the second factor which limited trade deficit deterioration during June. The competitive foreign exchange value of the dollar helped exports to rise by 2.0% after a firm 1.6% gain during May. Nevertheless, recessions abroad have lowered exports by 5.4% since December.
 The rise in petroleum imports was driven by higher crude oil
prices. They rose to a June average of $59.17 per barrel versus the
February low of $39.22. The recession and the rise in prices prompted,
however, a decline in the volume of petroleum imports. Despite a June
gain they have fallen roughly ten-percent since December. The recession
has had the additional effect on limiting the size of the trade deficit
by dropping nonoil goods imports. They fell a hefty 1.0% during June
for the ninth sharp monthly decline in a year.
The rise in petroleum imports was driven by higher crude oil
prices. They rose to a June average of $59.17 per barrel versus the
February low of $39.22. The recession and the rise in prices prompted,
however, a decline in the volume of petroleum imports. Despite a June
gain they have fallen roughly ten-percent since December. The recession
has had the additional effect on limiting the size of the trade deficit
by dropping nonoil goods imports. They fell a hefty 1.0% during June
for the ninth sharp monthly decline in a year.
Adjusted for price inflation overall and for higher oil prices specifically, the trade deficit in goods actually narrowed slightly during June to $35.9B, the lowest since 1999. It was down from $45.3B last June. Real non-auto consumer goods imports fell a hard 4.8% m/m and are down 17.8% y/y, near their lowest level since 2005. Automotive vehicles & parts imports were down by exactly one-half versus last year. Non-auto capital goods imports continued to reflect the weakness in investment and fell 24.4% y/y near their lowest level since 2004.
Though services imports rose 2.3% during June that followed ten months of decline and they were off by nearly one-third y/y. Travel imports were down 12.8% y/y as passenger fares dropped by 9.0%.
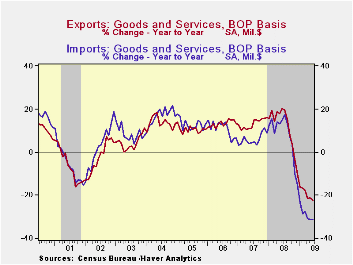
 Real exports added 0.6% to their 1.9% gain during May.
Nevertheless, recessions abroad caused them to fall by 21.4%
year-to-year to near the lowest level since late-2005. The chained
dollar value of non-auto consumer goods exports slipped m/m and were
down 13.8% y/y. Real capital goods exports jumped 1.5% but were off
20.6% y/y while exports of automobiles & parts were off by
roughly one-half from last year.
Real exports added 0.6% to their 1.9% gain during May.
Nevertheless, recessions abroad caused them to fall by 21.4%
year-to-year to near the lowest level since late-2005. The chained
dollar value of non-auto consumer goods exports slipped m/m and were
down 13.8% y/y. Real capital goods exports jumped 1.5% but were off
20.6% y/y while exports of automobiles & parts were off by
roughly one-half from last year.
Nominal exports of services rose 1.3% (-11.5% y/y) for the first material increase since last fall. Travel exports fell 18.8% y/y as fewer foreign citizens came to the U.S. even as passenger fares fell 22.5%.
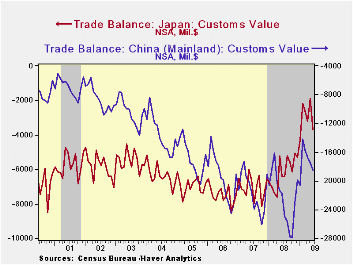
The U.S. trade deficit in goods with China deepened again, during June to $18.4B. Imports from China fell 14.1% y/y while U.S. exports fell a lesser 10.3%. The trade deficit with Japan deepened sharply to $3.7B but it remained near its shallowest since 1990. The U.S. recession drove imports from Japan down by 36.5% year-to-year while U.S. exports to the country fell by 30.4%.
| Foreign Trade | June | May | Y/Y | 2008 | 2007 | 2006 |
|---|---|---|---|---|---|---|
| U.S. Trade Deficit | $27.0B | $26.0B | $60.2B (6/08) | $695.9 | $701.4 | $760.4 |
| Exports - Goods & Services | 2.0% | 1.6% | -22.2% | 11.2% | 13.2% | 13.3% |
| Imports - Goods & Services | 2.3% | -0.6% | -31.1% | 7.6 | 6.0% | 10.8% |
| Petroleum | 23.8% | -3.4% | -51.9% | 37.0% | 9.4% | 20.1% |
| Nonpetroleum Goods | -1.0% | 0.1% | -29.1% | 1.5% | 4.8% | 9.1% |
by Robert Brusca August 12, 2009
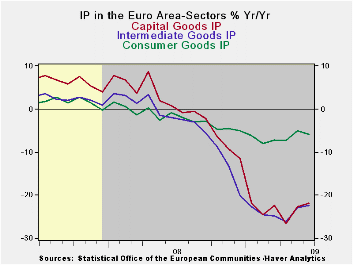
Euro Area industrial output rose in May but is back to its
declining ways in June. The negative rates of growth are still
diminishing to a decline of 4.8% over three months from -15.1% over six
months and from -18% over twelve months. Trend progress continues
despite the months set-back. And, with this monthly drop, the region
steps back behind the line that says it has turned the corner to
growth. It has not.
Nondurable output is actually increasing taking some of the
downward pressure of consumer goods output where durable goods trends
are still horrifically negative.
Country level trends have flattened out or show progress to
positive output In Germany, France, Spain and in the UK. Germany,
France and Spain show positive three-month output growth rates for MFG.
But over six- and twelve-months all the large countries are still
showing output declines.
Underling the erratic and slow nature of progress in EMU,
Germany’s July IFO report show some progress is still being made, but
at a snail’s pace. The IFO’s current conditions and expectations
readings edged higher, boosting the German index for business climate
in July. But the IFO’s overall and sector readings on diffusion tell us
that this progress while small is still not very widespread as
diffusion indices remain negative and made their own small progress in
the month. The biggest sector improvement in the current diffusion
index presentation was in retailing. Manufacturing made the biggest
improvement in the expectations section. But services made the turn
from a negative reading to a positive one in the expectations survey- a
significant development even if on a small two-point move.
Some of the luster from retailing’s gain in the current sector
survey is lost as the expectations for retailing made a similar but
opposite large move losing ground and blunting the current message of
improvement in the sector. .
Conditions in Germany and in EMU remain in flux. Trends are in
the right direction but some are still slow-moving. We still see
episodic signs of backtracking. It’s too soon to say it is recovery or
to be sure that we are going there, despite the strong readings from
the OECD leading indicators. Questions remain.
| E-zone MFG IP | ||||||||||
|---|---|---|---|---|---|---|---|---|---|---|
| Saar except m/m | Mo/Mo | Jun 09 |
May 09 |
Jun 09 |
May 09 |
Jun 09 |
May 09 |
|||
| Euro Area Detail | Jun 09 |
May 09 |
Apr 09 |
3Mo | 3Mo | 6mo | 6mo | 12mo | 12mo | Q-2 |
| MFG | -0.5% | 0.2% | -1.0% | -4.8% | -6.9% | -15.1% | -20.0% | -18.0% | -18.3% | -9.5% |
| Consumer | -0.3% | 0.3% | -0.1% | -0.3% | -0.5% | -4.9% | -5.5% | -5.8% | -5.1% | -3.2% |
| Consumer Durables | -4.2% | -1.8% | -0.7% | -23.7% | -11.5% | -23.8% | -21.5% | -24.4% | -19.9% | |
| Consumer Nondurables | 0.2% | 0.6% | 0.0% | 3.7% | 1.9% | -1.7% | -2.9% | -2.8% | -2.6% | |
| Intermediate Goods | -0.5% | 0.5% | -1.5% | -6.2% | -10.3% | -13.9% | -23.6% | -22.4% | -22.9% | -12.2% |
| Capital Goods | -0.3% | 1.0% | -2.9% | -8.6% | -6.9% | -22.8% | -26.5% | -21.9% | -22.7% | -12.5% |
| Main E-zone Countries and UK IP in MFG | ||||||||||
| Mo/Mo | Jun 09 |
May 09 |
Jun 09 |
May 09 |
Jun 09 |
May 09 |
||||
| MFG Only | Jun 09 |
May 09 |
Apr 09 |
3Mo | 3Mo | 6mo | 6mo | 12mo | 12mo | Q:2 Date |
| Germany | 0.2% | 5.0% | -3.1% | 8.2% | 10.6% | -16.3% | -24.5% | -19.8% | -19.5% | -1.9% |
| France: IP excl Construction | 0.3% | 2.8% | -1.4% | 7.2% | -1.8% | -10.0% | -13.3% | -12.8% | -13.2% | -3.2% |
| Italy | -1.2% | -0.2% | 0.6% | -3.4% | -15.9% | -21.4% | -26.3% | -23.9% | -22.7% | -17.8% |
| Spain | 3.9% | -6.9% | 5.9% | 10.1% | -22.2% | -17.7% | -21.6% | -14.4% | -22.4% | -2.3% |
| UK: EU member | 0.5% | -0.6% | 0.0% | -0.5% | -1.8% | -6.4% | -11.2% | -11.7% | -12.8% | -0.7% |
by Tom Moeller August 12, 2009
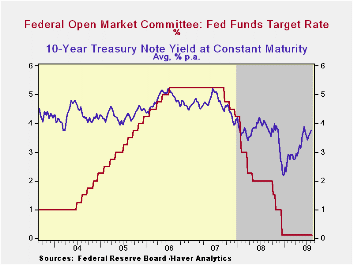
In an anticipated and unanimous vote, the Federal Open Market Committee today left the Federal funds rate in a "range from 0 to 1/4 percent." The discount rate also was left unchanged at 0.5%. The Fed funds rate remained the lowest ever.
The Fed indicated that "Conditions in financial markets have improved further in recent weeks. Household spending has continued to show signs of stabilizing but remains constrained by ongoing job losses, sluggish income growth, lower housing wealth, and tight credit.
Again, much of the commentary on the economy was similar to the last two meetings and concluded that "Although economic activity is likely to remain weak for a time, the Committee continues to anticipate that policy actions to stabilize financial markets and institutions, fiscal and monetary stimulus, and market forces will contribute to a gradual resumption of sustainable economic growth in a context of price stability."
Regarding inflation the FOMC statement acknowledged the rise in energy & other commodity prices, but concluded that substantial economic slack will leave inflation "subdued for some time."
In its effort to promote economic liquidity, the Fed used
similar language as in June, "... to provide support to mortgage
lending and housing markets and to improve overall conditions in
private credit markets, the Federal Reserve will purchase a total of up
to $1.25 trillion of agency mortgage-backed securities and up to $200
billion of agency debt by the end of the year. In addition, the Federal
Reserve will buy up to $300 billion of Treasury securities."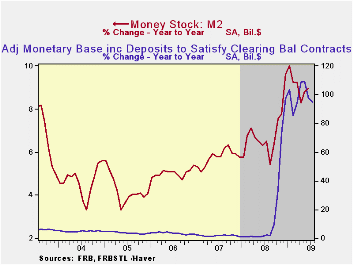
New was the indication that "the Committee has decided to gradually slow the pace of these transactions and anticipates that the full amount will be purchased by the end of October."
For the complete text of the Fed's latest press release please follow this link.
The Haver databases USECON, WEEKLY and DAILY contain the figures from the Federal Reserve Board.
The Shadow Banking System: Implications for Financial Regulation from the Federal Reserve Bank of New York can be found here.
What Do We Know (And Not Know) About Potential Output? from the Federal Reserve Bank of St. Louis is available here.
| Current | Last | December | 2008 | 2007 | 2006 | |
|---|---|---|---|---|---|---|
| Federal Funds Rate, % (Target) | 0.00 - 0.25 | 0.00 - 0.25 | 0.16 | 1.93 | 5.02 | 4.96 |
| Discount Rate, % | 0.50 | 0.50 | 0.50 | 2.39 | 5.86 | 5.96 |

Tom Moeller
AuthorMore in Author Profile »Prior to joining Haver Analytics in 2000, Mr. Moeller worked as the Economist at Chancellor Capital Management from 1985 to 1999. There, he developed comprehensive economic forecasts and interpreted economic data for equity and fixed income portfolio managers. Also at Chancellor, Mr. Moeller worked as an equity analyst and was responsible for researching and rating companies in the economically sensitive automobile and housing industries for investment in Chancellor’s equity portfolio. Prior to joining Chancellor, Mr. Moeller was an Economist at Citibank from 1979 to 1984. He also analyzed pricing behavior in the metals industry for the Council on Wage and Price Stability in Washington, D.C. In 1999, Mr. Moeller received the award for most accurate forecast from the Forecasters' Club of New York. From 1990 to 1992 he was President of the New York Association for Business Economists. Mr. Moeller earned an M.B.A. in Finance from Fordham University, where he graduated in 1987. He holds a Bachelor of Arts in Economics from George Washington University.
More Economy in Brief


