 Global| Oct 09 2009
U.S. Trade Deficit NarrowsSlightly But Petroleum Imports Drop Sharply
by:Tom Moeller
|in:Economy in Brief
Summary
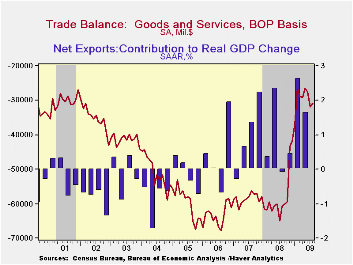
Though oil prices have risen, the recession in the U.S. economy has prompted a sharp cutback in the dollar amount of oil imports. That cutback helped the international trade deficit to narrow during August to $30.7.0B versus a little- [...]
 Though
oil prices have risen, the recession in the U.S. economy has prompted a
sharp cutback in the dollar amount of oil imports. That cutback helped
the international trade deficit to narrow during August to $30.7.0B
versus a little-revised July deficit of $31.9B. Consensus expectations
had been for a deeper August deficit of $33.0B.
Though
oil prices have risen, the recession in the U.S. economy has prompted a
sharp cutback in the dollar amount of oil imports. That cutback helped
the international trade deficit to narrow during August to $30.7.0B
versus a little-revised July deficit of $31.9B. Consensus expectations
had been for a deeper August deficit of $33.0B.
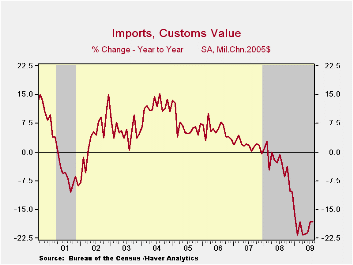
During August, oil imports were cutback by 5.7% m/m and have declined by more than one-half y/y due to lower prices. Moreover, the recession part of the story was clear: Imports of petroleum products in constant dollar terms fell 10.4% and were down 13.8% y/y. The decline in petroleum imports occurred despite higher crude oil prices. Prices rose to an August average of $64.75 per barrel versus the February low of $39.22.
The recession's influence also was apparent in
nonoil imports which ticked lower by 0.1% but were down by 19.7% y/y.
Real non-auto consumer goods imports fell by 1.9% (-16.3% y/y).
Non-auto capital goods imports slipped 0.3% after a strong July gain
and that left them off 19.9% from last year. Real automotive vehicles
& parts imports, however, were strong for the third strait
month. 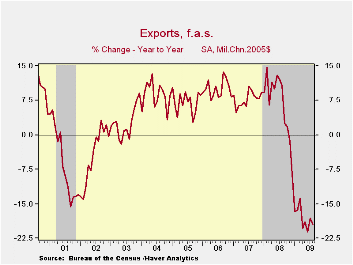 They rose 8.4% but they still were off by one-quarter from last
year.
They rose 8.4% but they still were off by one-quarter from last
year.
Reflecting the competitive value of the dollar, real merchandise exports fell during August just 1.5% following three months of increase. Nevertheless, recessions abroad lowered real exports by 19.5% y/y. The chained dollar value of real capital goods exports led the August decline with a 4.2% drop (-23.9% y/y. Non-auto consumer goods exports fell a lesser 1.4% (-11.4% y/y) while auto exports rose for the third strait month (-28.9% y/y).
Imports of services fell 15.4% y/y as travel imports were off 7.8%, i.e., fewer U.S. residents went abroad, and passenger fares were off 24.7%. Exports of services fell 11.8% as travel exports fell 20.3% y/y and passenger fares fell by one-quarter.
 The
international trade data can be found in
Haver's USECON database. Detailed figures are
available in the USINT database.
The
international trade data can be found in
Haver's USECON database. Detailed figures are
available in the USINT database.
Monetary Policy Research and the Financial Crisis: Strengths and Shortcomings is today's speech by Fed Vice Chairman Donald L. Kohn and it is available here.
In the Wake of the Crisis is yesterday's speech by Fed Governor Daniel K. Tarullo and it can be found here.
| Foreign Trade | August | July | Y/Y | 2008 | 2007 | 2006 |
|---|---|---|---|---|---|---|
| U.S. Trade Deficit | $30.7B | $31.9B | $60.9B (8/08) | $695.9 | $701.4 | $760.4 |
| Exports - Goods & Services | 0.2% | 2.5% | -20.7% | 11.2% | 13.2% | 13.3% |
| Imports - Goods & Services | -0.6% | 4.9% | -28.6% | 7.6 | 6.0% | 10.8% |
| Petroleum | -5.7% | 3.3% | -51.9% | 37.0% | 9.4% | 20.1% |
| Nonpetroleum Goods | 0.3% | 6.4% | -24.6% | 1.5% | 4.8% | 9.1% |
by Robert Brusca October 9, 2009
OECD gets upbeat - The OECD is getting much
more upbeat in its assessment of the world's leading economies. It now
contends that they may now be recovering or growing after hitting the
bottom of their respective economic recessions in 2009. Recovery is at
hand, according to leading indicators released Friday by the
Organization for Economic Cooperation and Development that is the
newest development.
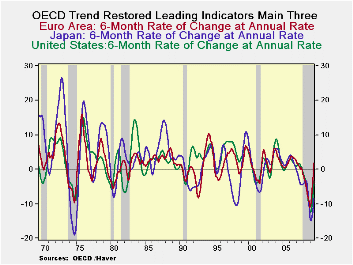
Good and somewhat surprising news - The OECD
trend-restored leading indicators continue to point to a recovery for
most developed economies. France and Italy - that have both posted
three or more months of an index level above the key 100 mark - are
now, in the OECD lexicon, experiencing "potential expansion." The
Composite Leading Indicator for the OECD's 30 members rose for the
sixth straight month in August to reach 99.2 from 97.7 in July that is
very close to the 100 line that it must cross to be truly on the road
to an optimistic result. "OECD composite leading indicators for August
2009 continue to point to a recovery in all major economies with CLIs
for France and Italy pointing to expansion," the OECD said.
Who’d a’ thunk it? Italy and France lead
- For now that is certainly a breath of fresh air. Various national
sources have been showing the same sorts of results. The surprise is
that Italy joins France as one of the recovery leaders. Italy’s
consumer confidence measures have been moving up briskly but Italy is
still having some difficulties and business confidence has recently
slipped. In contest France continues to pump out good figures as public
spending there has been effective in stopping the bleeding and turning
things around.
...and the US is - Over 12-months the US is still
seeing its OECD CLI drop but over three-months the US index is rising
nearly as fast as the indicators for the e-Zone. Over six months the US
is still doing well but it is several steps behind the e-Zone reading
and others. The six month horizon is the assessment favored by the OECD.
A good report card for the global economy - For now
it’s a good report card on a global economy that is making progress.
The rise up from this recession’s relatively deep pit is at a strongly
sloped gradient compared to past cycles. Despite all the pessimism
about growth and growth prospects the OECD’s CLI’s look very upbeat
indeed.
| OECD Trend-restored leading Indicators | ||||
|---|---|---|---|---|
| Growth progression SAAR | ||||
| 3-Mos | 6-Mos | 12-Mos | Yr-Ago | |
| OECD | 17.4% | 12.9% | -1.3% | -5.2% |
| OECD 7 | 18.7% | 13.2% | -2.5% | -5.7% |
| OECD Euro Area | 19.7% | 16.2% | 1.8% | -6.6% |
| OECD Japan | 12.5% | 6.8% | -8.4% | -4.1% |
| OECD US | 19.3% | 12.8% | -3.5% | -5.4% |
| Six month readings at 6-Mo Intervals: | ||||
| Recent six | 6-Mos Ago | 12-Mos Ago | 18-Mos Ago | |
| OECD | 12.9% | -13.8% | -8.3% | -2.1% |
| OECD 7 | 13.2% | -15.9% | -8.4% | -3.0% |
| OECD Euro Area | 16.2% | -10.8% | -10.5% | -2.5% |
| OECD Japan | 6.8% | -21.5% | -7.1% | -0.9% |
| OECD US | 12.8% | -17.4% | -7.2% | -3.6% |
| Slowdowns indicated by BOLD RED | ||||

Tom Moeller
AuthorMore in Author Profile »Prior to joining Haver Analytics in 2000, Mr. Moeller worked as the Economist at Chancellor Capital Management from 1985 to 1999. There, he developed comprehensive economic forecasts and interpreted economic data for equity and fixed income portfolio managers. Also at Chancellor, Mr. Moeller worked as an equity analyst and was responsible for researching and rating companies in the economically sensitive automobile and housing industries for investment in Chancellor’s equity portfolio. Prior to joining Chancellor, Mr. Moeller was an Economist at Citibank from 1979 to 1984. He also analyzed pricing behavior in the metals industry for the Council on Wage and Price Stability in Washington, D.C. In 1999, Mr. Moeller received the award for most accurate forecast from the Forecasters' Club of New York. From 1990 to 1992 he was President of the New York Association for Business Economists. Mr. Moeller earned an M.B.A. in Finance from Fordham University, where he graduated in 1987. He holds a Bachelor of Arts in Economics from George Washington University.
More Economy in Brief


