 Global| Jan 10 2007
U.S. Trade Deficit Narrowed Unexpectedly
by:Tom Moeller
|in:Economy in Brief
Summary
The U.S. foreign trade deficit narrowed unexpectedly in November to $58.2B from a little revised $58.8B during October. The deficit was the shallowest since July of last year and compared to Consensus expectations for a deficit of [...]
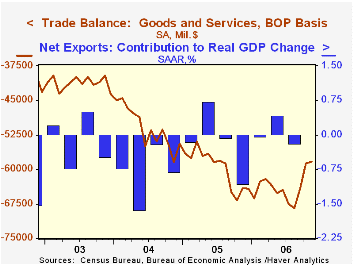
The U.S. foreign trade deficit narrowed unexpectedly in November to $58.2B from a little revised $58.8B during October. The deficit was the shallowest since July of last year and compared to Consensus expectations for a deficit of $60.0B.
The value of petroleum product imports fell 9.3% (-11.2% y/y) as the per barrel cost of crude oil petroleum imports fell 5.8% m/m to $52.25 and the quantity of crude oil imports fell 0.8% (-4.7% y/y).
Imports of nonpetroleum products rose 0.3% (7.8% y/y) after two months of decline. Capital goods imports rose 0.9% (10.7% y/y) and imports of nonauto consumer goods surged 2.3% (15.0% y/y), the strongest monthly gain since June. Imports of advanced technology products rose 0.4% (14.2% y/y).
Total exports rose a strong 0.9% goosed by a 1.9% (13.0% y/y) rise in capital goods exports. Exports of complete civilian aircraft jumped 15.7% (36.9% y/y) and aircraft parts & engines exports also rose a strong 7.9% (19.2% y/y). Computer exports slipped 6.3% (+16.1% y/y) and exports of nonauto consumer goods rose 1.4% (13.5% y/y) after October's 3.7% jump.
Service exports jumped another 1.4% (9.8% y/y) as travel exports surged 2.6% (11.8% y/y) and passenger fares jumped 2.9% (6.5% y/y). Imports of services also rose a strong 0.9% (9.0% y/y) reflecting a 2.7% (12.5% y/y) rise in travel and a 3.9% jump in passenger fares (6.0% y/y).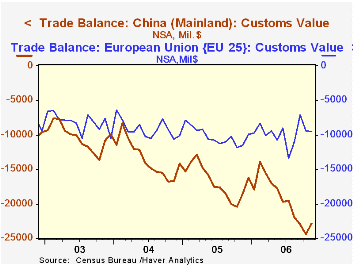
The U.S. trade deficit in goods with China narrowed slightly to $22.9B in November ($201.5B in 2005) as imports fell s sharp 5.2% (+23.9% y/y). The balance of goods trade with the newly industrialized Asian also narrowed to a deficit $0.4B (-$15.8B in 2005), the smallest since March of last year, as exports surged 6.5% (33.2% y/y) and imports fell 6.2% (+0.8% y/y).
The trade deficit with Europe deepened slightly m/m to $9.5B as US exports fell 1.1% (+14.6% y/y) and imports slipped 0.6% (+1.4%% y/y).
China's Strategic Petroleum Reserve: A Drop in the Bucket from the Federal Reserve Bank of St. Louis can be found here.
| Foreign Trade | November | October | Y/Y | 2005 | 2004 | 2003 |
|---|---|---|---|---|---|---|
| U.S. Trade Deficit | $58.2B | $58.8B | $64.0B (11/05) |
$716.7B | $611.3B | $494.9B |
| Exports - Goods & Services | 0.9% | 0.3% | 13.4% | 10.7% | 13.4% | 4.2% |
| Imports - Goods & Services | 0.3% | -2.7% | 5.2% | 13.0% | 16.7% | 8.3% |
by Tom Moeller January 10, 2007
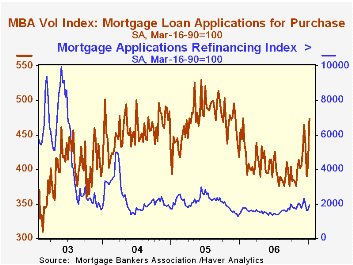
The total number of mortgage applications surged 16.6% last week, the strongest weekly increase since June 2005 according to the Mortgage Bankers Association.
Purchase applications jumped 16.2% and raised the level of applications in early January 11.3% above the December average which rose 4.7% from November.
During the last ten years there has been a 58% correlation between the y/y change in purchase applications and the change in new plus existing single family home sales.
Applications to refinance also were strong and jumped 17.2%. Applications to refinance in early January were 1.2% above the December average which was unchanged from November.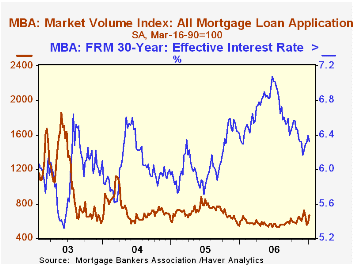
The effective interest rate on a conventional 30-year mortgage fell w/w to 6.32% but remained up slightly from the December average of 6.28%. The peak for 30 year financing was 7.08% late in June. Rates for 15-year financing also fell sharply to 6.10%. Interest rates on 15 and 30 year mortgages are closely correlated (>90%) with the rate on 10 year Treasury securities.
During the last ten years there has been a (negative) 79% correlation between the level of applications for purchase and the effective interest rate on a 30-year mortgage.
The Mortgage Bankers Association surveys between 20 to 35 of the top lenders in the U.S. housing industry to derive its refinance, purchase and market indexes. The weekly survey covers roughly 50% of all U.S. residential mortgage applications processed each week by mortgage banks, commercial banks and thrifts. Visit the Mortgage Bankers Association site here.
| MBA Mortgage Applications (3/16/90=100) | 01/05/07 | 12/29/06 | Y/Y | 2006 | 2005 | 2004 |
|---|---|---|---|---|---|---|
| Total Market Index | 671.1 | 575.6 | 11.8% | 584.2 | 708.6 | 735.1 |
| Purchase | 472.8 | 406.9 | 3.4% | 406.9 | 470.9 | 454.5 |
| Refinancing | 1,923.8 | 1,640.4 | 28.5% | 1,634.0 | 2,092.3 | 2,366.8 |
by Carol Stone January 10, 2007
The US Census Bureau publishes a voluminous amount of foreign trade data. So along with the national summary reported on by Tom Moeller, we will highlight for you one specific set of associated data, exports by state.
These shipments are counted from their "origin of movement", that is where the transportation begins, rather than where the merchandise leaves the country. Census publishes total figures monthly for each state, and it publishes quarterly information on product and destination country, an extraordinarily detail dataset. The total data are contained in Haver's REGIONAL database, a wide-ranging collection of various economic data for states. The breakdown of state export data by product is a set of databases each covering a Census division of states. In EXPRQ6, for example, you can find the shipping weight of non-electrical machinery sent by ship or air from Tennessee to Aruba.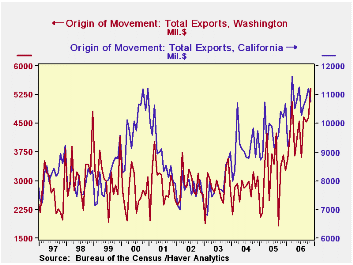
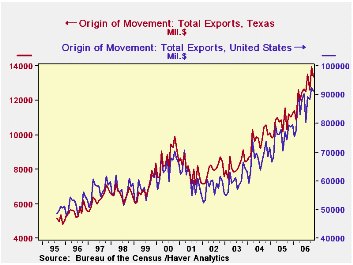
The state export totals appear in a supplemental table in the Census Bureau's main FT900 International Trade press release. In our table below, we show the US Total and a selection of states. We picked the three largest exporters, Texas, California and Washington, and also a few others from various regions: Missouri in the midwest, Georgia in the southeast and Massachusetts in New England. All these data are not seasonally adjusted and are reported in current dollars on the so-called "Census" basis.
Total US exports in November were up 15.7% from a year ago. A number of states are showing more rapid expansion than that, particularly Texas, which is the largest exporter in dollar terms. It shipped $13.35 billion of merchandise to customers abroad in November, 20.9% more than November 2005. We can also compare these exports for a full year to gross state product (Haver database GSP); in 2005 they made 13% of Texas state product. California runs second in dollar value of exports, with $10.8 billion in November shipments; this was up 5.5% from the year-ago period. California exports were 7.2% of its GSP in 2005. Interestingly, Washington State is third; we haven't looked, but we'd guess that aircraft and computer software make a large portion of the goods, which amounted to $5.4 billion in November, up a whopping 47.6% from the year before; exports constitute 14.2% of Washington's gross product. [New York State's total exports are marginally larger, but include more reexports, so they would represent less value added.]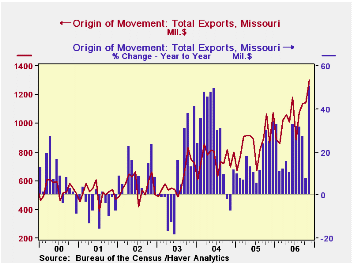
Among the other states shown here, Missouri is seeing notable expansion of its export business. While November's shipments look small at just $1.3 billion, they are up 51% from a year ago and were more than double the 2003 amount.
We'd also surmise -- without much investigation, to be sure -- that sizable overall export growth is related to the recently weak dollar. It's also important to note that outsourcing and other aspects of globalization do not work only to the detriment of the US economy. One reason for the publication of these data is a desire by officials in various states to show how their state can be competitive in world markets and thereby create jobs.
| US Exports by State (NSA, Mil.$) | Nov 2006 | Oct 2006 | Sept 2006 | 2005 | 2004 | 2003 |
|---|---|---|---|---|---|---|
| Total US | 91240 | 92476 | 88428 | 75365 | 68046 | 60312 |
| Yr/Yr % Chg | 15.7 | 16.3 | 19.0 | 10.8 | 12.8 | 4.4 |
| Texas | 13350 | 13959 | 12576 | 10730 | 9762 | 8237 |
| Yr/Yr % Chg | 20.9 | 24.8 | 21.7 | 9.9 | 18.5 | 3.6 |
| California | 10761 | 11216 | 10862 | 9735 | 9155 | 7833 |
| Yr/Yr % Chg | 5.5 | 7.6 | 13.4 | 6.3 | 16.9 | 1.9 |
| Washington | 5410 | 4651 | 4546 | 3162 | 2814 | 2848 |
| Yr/Yr % Chg | 47.6 | 37.7 | 149.3 | 12.4 | -1.2 | -1.3 |
| Missouri | 1303 | 1143 | 1135 | 872 | 748 | 603 |
| Yr/Yr % Chg | 50.8 | 7.5 | 27.4 | 34.1 | 11.9 | 41.1 |
| Massachusetts | 2034 | 2175 | 2042 | 1837 | 1818 | 1555 |
| Yr/Yr % Chg | 7.9 | 15.3 | 7.3 | 1.1 | 16.9 | 11.7 |
| Georgia | 1629 | 1801 | 1656 | 1715 | 1633 | 1357 |
| Yr/Yr % Chg | 5.4 | 8.3 | -3.2 | 5.0 | 20.3 | 13.0 |

Tom Moeller
AuthorMore in Author Profile »Prior to joining Haver Analytics in 2000, Mr. Moeller worked as the Economist at Chancellor Capital Management from 1985 to 1999. There, he developed comprehensive economic forecasts and interpreted economic data for equity and fixed income portfolio managers. Also at Chancellor, Mr. Moeller worked as an equity analyst and was responsible for researching and rating companies in the economically sensitive automobile and housing industries for investment in Chancellor’s equity portfolio. Prior to joining Chancellor, Mr. Moeller was an Economist at Citibank from 1979 to 1984. He also analyzed pricing behavior in the metals industry for the Council on Wage and Price Stability in Washington, D.C. In 1999, Mr. Moeller received the award for most accurate forecast from the Forecasters' Club of New York. From 1990 to 1992 he was President of the New York Association for Business Economists. Mr. Moeller earned an M.B.A. in Finance from Fordham University, where he graduated in 1987. He holds a Bachelor of Arts in Economics from George Washington University.
More Economy in Brief


