 Global| Nov 09 2006
U.S. Trade Deficit Narrowed Sharply
by:Tom Moeller
|in:Economy in Brief
Summary
Lower oil prices in September caused the U.S. foreign trade to reverse the prior month's run up and fall to $64.3B. The record August deficit was revised shallower to $69.0B. The latest figure also was shallower than Consensus [...]
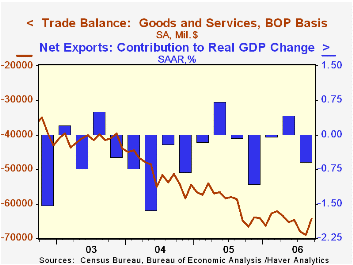
Lower oil prices in September caused the U.S. foreign trade to reverse the prior month's run up and fall to $64.3B. The record August deficit was revised shallower to $69.0B. The latest figure also was shallower than Consensus expectations for a deficit of $66.0B.
Imports of petroleum products fell 10.5% (+10.4% y/y) as the per barrel price of crude oil fell 5.4% to $62.52 and the quantity of crude imported per day fell 4.8% (+14.0% y/y). The price of oil in October fell another five dollars per barrel.
Overall September imports of goods & services fell 2.1% m/m and fully reversed the August gain. Imports of nonpetroleum products, however, fell only 0.7% (+9.6% y/y) after a 2.5% August rise. Imports of capital goods fell just 1.5% (10.9% y/y) after two months of gain exceeding 2% and nonauto consumer goods imports rose 1.5% (11.2% y/y), the same as during August. Automotive imports fell 1.9% (+4.1% y/y) while imports of crude materials less fuels fell 8.1% (NSA, +12.1% y/y).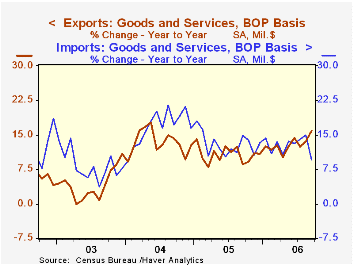
Total exports added 0.5% to the firm 2.4% August gain as capital goods exports jumped another 2.0% (22.1% y/y). Exports of civilian aircraft surged by more than one third (308.2% y/y) but computer exports fell (+6.5% y/y). Exports of telecommunications equipment rose 2.3% (15.5% y/y) while exports of nonauto consumer goods fell 3.2% (+9.0% y/y) after several months of strong gain.
Service exports slipped 0.1% (+6.5% y/y) as travel exports fell 0.9% (+2.5% y/y) and passenger fares dipped 0.5% (-2.3% y/y). Imports of services ticked up 0.2% (7.9% y/y) though passenger fares fell 1.3% (-0.9% y/y).
The U.S. trade deficit in goods with China deepened to another record $23.0B in September ($201.5B in 2005) as exports fell 2.7% (+44.5% y/y) but imports rose 3.3% (18.5% y/y). With the newly industrialized Asian countries, the balance of goods trade narrowed sharply m/m to a deficit of $0.7B (-$15.8B in 2005) as exports rose 3.8% (+22.5% y/y) and imports fell 6.8% (+8.2% y/y).
Twin Deficits, Twenty Years Later from the Federal Reserve Bank of New York is available here.
| Foreign Trade | September | August | Y/Y | 2005 | 2004 | 2003 |
|---|---|---|---|---|---|---|
| U.S. Trade Deficit | $64.3B | $69.0B | $65.0B (9/05) |
$716.7B | $611.3B | $494.9B |
| Exports - Goods & Services | 0.5% | 2.4% | 15.8% | 10.7% | 13.4% | 4.2% |
| Imports - Goods & Services | -2.1% | 2.0% | 9.4% | 13.0% | 16.7% | 8.3% |
by Tom Moeller November 9, 2006
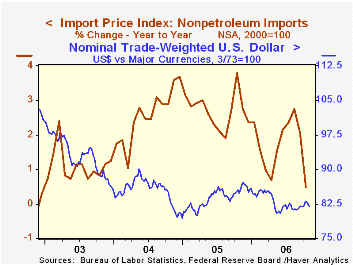
In October, total import prices repeated the prior month's 2.0% decline and doubled Consensus expectations for a 1.0% drop.
Prices of petroleum imports plunged another 8.3% after the 9.7% September drop but in November the price of Brent crude oil is up from the $57.70 per bbl. averaged in October.
Less petroleum import prices fell 0.6%, the largest monthly decline since February. During the last ten years there has been a 66% (negative) correlation between the nominal trade-weighted exchange value of the US dollar vs. major currencies and the y/y change in non oil import prices. The correlation is a lower 47% against a broader basket of currencies.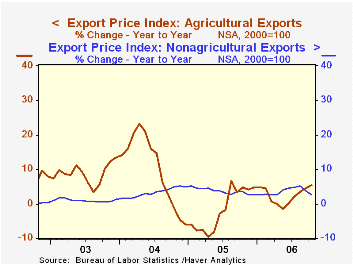
Capital goods prices slipped 0.1% (-0.1% y/y) but excluding computers, capital good prices rose 0.2% (2.0% y/y). Prices for nonauto consumer goods rose 0.1% (1.0% y/y) for the third month while prices for nonoil industrial supplies & materials fell 2.7% (-0.7% y/y) due to lower selected building materials prices (-6.1% y/y).
Have U.S. Import Prices Become Less Responsive to Changes in the Dollar? from the Federal Reserve Bank of New York can be found here.
Export prices fell 0.4% for the second month as nonagricultural commodities prices dropped 0.5% (+2.6% y/y) but agricultural export prices rose 1.1% (5.4% y/y).
| Import/Export Prices (NSA) | October | September | Y/Y | 2005 | 2004 | 2003 |
|---|---|---|---|---|---|---|
| Import - All Commodities | -2.0% | -2.0% | -0.2% | 7.5% | 5.6% | 2.9% |
| Petroleum | -8.3% | -9.7% | -2.9% | 37.6% | 30.5% | 21.0% |
| Non-petroleum | -0.6% | 0.2% | 0.5% | 2.7% | 2.6% | 1.1% |
| Export- All Commodities | -0.4% | -0.4% | 2.8% | 3.2% | 3.9% | 1.6% |
by Tom Moeller November 9, 2006
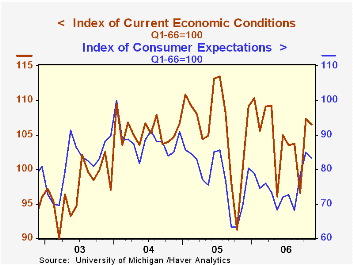
The University of Michigan's preliminary reading of consumer sentiment during November slipped 1.4% from October to 92.3 after that month's 9.6% jump. The decline slightly exceeded Consensus expectations for a decline to 93.3.
During the last ten years there has been a 76% correlation between the level of consumer sentiment and the y/y change in real consumer spending and during those ten years sentiment has a 68% correlation with the change in nonfarm payrolls.
Expectations for the economy retraced 1.9% of the prior month's 8.4% m/m surge due to a lessened expected change in personal finances which retraced all of October's gain (+5.2% y/y). Expected business conditions next year added slightly (38.6% y/y) to the sharp gains of the prior two months and over the next five years also rose a firm 1.0% (22.5% y/y) to the highest since July 2005. 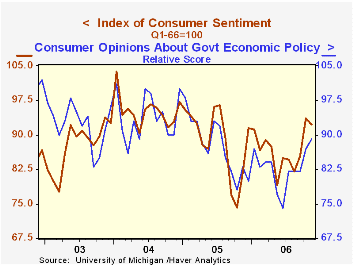
The reading of current economic conditions slipped 0.7% as the current read of personal finances fell 0.8% (+13.6% y/y) and perceived buying conditions for large household goods fell 0.6% (+1.3% y/y.
Expected inflation during the next year fell to 3.4%, the lowest since early 2005. Since 1980 there has been an inverse 63% correlation between the level of sentiment and expected inflation during the next year. The five to ten year expected rate of inflation also fell m/m to 3.3%.
Consumers' opinion about gov't economic policy improved 2.3% (7.2% y/y).
The University of Michigan survey is not seasonally adjusted.The mid-month survey is based on telephone interviews with 250 households nationwide on personal finances and business and buying conditions. The survey is expanded to a total of 500 interviews at month end.
| University of Michigan | November (Prelim.) | October | Y/Y | 2005 | 2004 | 2003 |
|---|---|---|---|---|---|---|
| Consumer Sentiment | 92.3 | 93.6 | 13.1% | 88.6 | 95.2 | 87.6 |
| Current Conditions | 106.5 | 107.3 | 6.3% | 105.9 | 105.6 | 97.2 |
| Expectations | 83.2 | 84.8 | 19.5% | 77.4 | 88.5 | 81.4 |
by Tom Moeller November 9, 2006
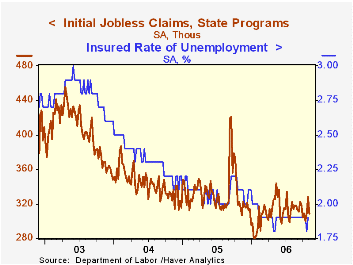
Initial claims for unemployment insurance reversed the prior week's jump and fell 20,000 last week to 308,000. Consensus expectations had been for a lesser decline to 315,000 claims.
During the last ten years there has been a (negative) 78% correlation between the level of initial claims and the m/m change in nonfarm payroll employment.
The four-week moving average of initial claims was nearly unchanged at 311,250 (-4.2% y/y).
With a 43,000 increase, continuing claims for unemployment insurance reversed a deepened decline the prior week.
The insured rate of unemployment backed up to 1.9%.
Construction Slowdown from the Federal Reserve Bank of Richmond can be found here.
| Unemployment Insurance (000s) | 11/04/06 | 10/28/06 | Y/Y | 2005 | 2004 | 2003 |
|---|---|---|---|---|---|---|
| Initial Claims | 308 | 328 | -2.5% | 332 | 343 | 403 |
| Continuing Claims | -- | 2,448 | -10.3% | 2,662 | 2,924 | 3,532 |
by Carol Stone November 9, 2006

Easing oil prices also helped ease the trade deficit in the UK. It fell to £4.1 billion in September from £4.5 billion in August. The deficit on goods alone was £6.6 billion, down from £6.9 billion. Total exports of goods and services stood at £29.2 billion, actually down a bit from £29.3 billion in August. Imports fell more, to £33.3 billion from £33.8 billion. Excluding oil the balance was basically unchanged from August to September at -£6.1 billion. Thus, for now, erosion in the trade accounts due to the surging value of oil imports has been stopped.
However, the interesting story to us in this month's UK trade data is the report for the first time of the amount of VAT-evasion fraud in the data. The VAT rate in the UK is 17.5% on most goods. Some unscrupulous business people want to avoid paying this amount to Her Majesty's Treasury. Using the trading system and the VAT collection system itself, they not only avoid paying the tax, but also in some cases actually pocket the revenues for themselves. 
These practices first came to light about six years ago and their impact on trade data started to get notice in 2003. Last year and now again this month, Her Majesty's Revenue and Customs (HMRC) have enhanced their enforcement efforts and identified larger quantities of misrouted trade. Initially, the practice was confined to EU trade, where cross-border transactions are largely unsupervised. Now, as HMRC has picked up the fraud more there, the perpetrators have moved to other countries, specifically Dubai and Switzerland, according to the ONS press release. Cell phones and computer components are apparently the most frequent items involved in these practices.
Traders import merchandise and then sell it on, either domestically or abroad. Then they "disappear" without making the required VAT payments. Thus, this scheme is called "Missing Trader Intra-Community [EU] fraud, known as MTIC. The "customers" may sometimes be their own business associates, who sell the goods again in order to pocket the VAT again. Then it is called a "carousel cycle". For most of the time since 1999, this has been small: at most £1 billion per month and usually £200-300 million. But over the last year, it has grown much more significantly, as seen in the table below. In Q1 and Q2 particularly, it amounted to £9.8 billion and £12.9 billion, respectively, accounting for nearly 16% and just over 19% of reported UK exports. The decline in exports in Q3 is almost totally absorbed by a reduction in the illegal MTIC trade, which was "only" £3.6 billion. 
Probably data users who are well acquainted with the UK are aware of this issue, but others need to know. Most recently, it has greatly distorted both exports and imports and complicates interpretation of the data on them. For instance, the sharp drop in trade in Q3 could signal less rigor in the UK economy, but instead, evidently, it signals more rigorous law enforcement. The ONS is so concerned about the mixed signals in this information that its initial brief announcement of the September data consisted in more text about data reliability than about the figures themselves, much as this comment does. Note that we have highlighted the export side in our discussion, but imports are involved just as much.ONS introduced today quarterly data on the MTIC "fraud trade", along with current price and chained price series of exports and imports net of this phantom activity. Haver's database managers are preparing to enter these series in the UK database. Clients can watch Data News in the Client Area of Haver.com and in HaverSelect.com for their availability.
| UK, Seas Adjusted | Sept 2006 | Aug 2006 | July 2006 | Year Ago | Monthly Averages|||
|---|---|---|---|---|---|---|---|
| 2005 | 2004 | 2003 | |||||
| Million £Trade Balance: Goods & Services | -4,087 | -4,544 | -4,699 | -4,205 | -3,775 | -2,915 | -2,454 |
| Balance on Goods | -6,560 | -6,856 | -7,055 | -6,033 | -5,723 | -5,074 | -4,051 |
| Exports of Goods | 19,182 | 19,396 | 18,846 | 18,596 | 17,641 | 15,906 | 15,693 |
| Imports of Goods | 25,742 | 26,252 | 25,901 | 24,629 | 23,364 | 20,981 | 19,744 |
| Goods Bal ex Oil | -6,101 | -6,134 | -6,725 | -5,315 | -5,541 | -5,149 | -4,332 |
| Q3 2006 | Q2 2006 | Q1 2006 | Q4 2005 | Quarterly Averages | |||
| Billion £Reported Exports | 57.4 | 67.1 | 62.7 | 56.4 | 52.9 | 47.7 | 47.1 |
| MTIC Fraud | 3.6 | 12.9 | 9.8 | 4.4 | 2.8 | 0.6 | 1.1 |
| Exports Net of Fraud | 53.8 | 54.1 | 52.9 | 52.0 | 50.1 | 47.0 | 46.0 |

Tom Moeller
AuthorMore in Author Profile »Prior to joining Haver Analytics in 2000, Mr. Moeller worked as the Economist at Chancellor Capital Management from 1985 to 1999. There, he developed comprehensive economic forecasts and interpreted economic data for equity and fixed income portfolio managers. Also at Chancellor, Mr. Moeller worked as an equity analyst and was responsible for researching and rating companies in the economically sensitive automobile and housing industries for investment in Chancellor’s equity portfolio. Prior to joining Chancellor, Mr. Moeller was an Economist at Citibank from 1979 to 1984. He also analyzed pricing behavior in the metals industry for the Council on Wage and Price Stability in Washington, D.C. In 1999, Mr. Moeller received the award for most accurate forecast from the Forecasters' Club of New York. From 1990 to 1992 he was President of the New York Association for Business Economists. Mr. Moeller earned an M.B.A. in Finance from Fordham University, where he graduated in 1987. He holds a Bachelor of Arts in Economics from George Washington University.
More Economy in Brief


