 Global| Jan 12 2006
U.S. Trade Deficit Narrowed as Oil Prices Fell
by:Tom Moeller
|in:Economy in Brief
Summary
The U.S. foreign trade deficit in November narrowed to $64.2B from the record $68.1B the prior month which was revised slightly shallower from the initial estimate. Consensus expectations had been for a narrowing to $66.1B. Imports of [...]
The U.S. foreign trade deficit in November narrowed to $64.2B from the record $68.1B the prior month which was revised slightly shallower from the initial estimate. Consensus expectations had been for a narrowing to $66.1B.
Imports of petroleum products reversed about half of the prior month's gain with a 3.1% decline. The drop was wholly due to lower prices. The per barrel price of crude oil dropped 7.3% (+26.6% y/y) to $52.16 but the per day volume of crude oil imports rose 6.7% (-4.6% y/y). In December, crude oil prices backed up to roughly $53.50 but in January have risen another $5.00 per barrel. 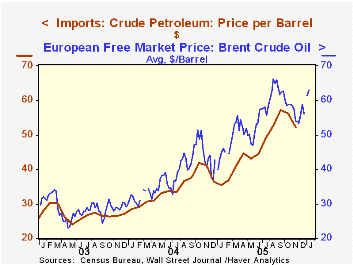
A 1.1% (+8.3% y/y) decline in imports of nonpetroleum products reversed much of the October increase. Imports of nonauto consumer goods fell 3.1% (+2.6% y/y) and capital goods imports slipped 0.1% (+8.1% y/y). Imports of advanced technology products were unchanged (NSA, 8.1% y/y) following several months of strong gain.
Total exports rose strongly for the third of the last four months. The 1.8% increase was led by a 3.7% (16.1% y/y) jump in capital goods. Exports of advanced technology products added 0.4% (NSA, 16.5% y/y) to the 10.4% spike in October. Consumer goods exports also reversed the prior month's weakness and surged 6.2% (12.3% y/y).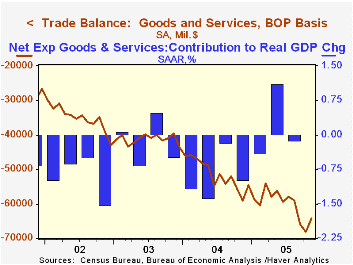
Services exports fell moderately for the second consecutive month. The 0.7% (+6.4% y/y) decline owed to a 2.5% (+6.4% y/y) decline in private travel and a 3.5% (+8.2% y/y) drop in passenger fares. Imports of services rose 0.5% (5.8% y/y) as passenger fares rose 1.6% (4.6% y/y) but travel fell 1.3% (+0.1% y/y). Travel imports have fallen 9.8% since the peak in April.
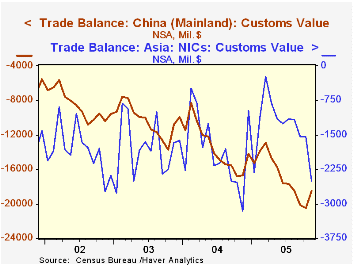
The US trade deficit with China improved to $18.5B ($161.9B in 2004) from the record deficit in October. The US trade deficit with Japan also improved very slightly m/m to $7.3B ($75.6B in 2004) but the monthly trade deficit with the Asian NICs deepened sharply to $2.5B ($21.9B in 2004). The deficit with the European Union improved $11.2B ($109.3B in 2004) from the record of $12.1n October.
What Determines Bilateral Trade Flows? from the Federal Reserve Bank of Chicago can be found here.
| Foreign Trade | Nov | Oct | Y/Y | 2004 | 2003 | 2002 |
|---|---|---|---|---|---|---|
| Trade Deficit | $64.2B | $68.1B | $59.0B (11/04) | $617.6B | $494.8B | $421.2B |
| Exports - Goods & Services | 1.8% | 1.5% | 10.8% | 12.6% | 4.6% | -3.0% |
| Imports - Goods & Services | -1.1% | 2.2% | 10.1% | 16.6% | 8.5% | 2.1% |
by Tom Moeller January 12, 2006
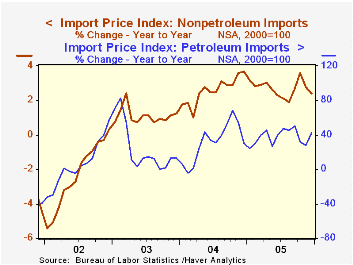
The import prices fell 0.2% last month following the little revised 1.8% drop during November and contrasted with Consensus expectations for a 0.2% increase.
Nonpetroleum again were weak and posted no change versus November. The weakness, however, followed an upwardly revised 0.1% increase the prior month and sharp increases of 0.8% & 0.9% during September and October. Prices for nonauto consumer goods were unchanged (0.5% y/y) though capital goods prices fell 0.1% (-1.1% y/y). Excluding another 0.1% decline in computer prices (-6.2% y/y), capital goods prices fell 0.2% (+1.2% y/y).
During the last ten years there has been a 66% (negative) correlation between the nominal trade-weighted exchange value of the US dollar vs. major currencies and the y/y change in non oil import prices. The correlation is a lower 47% against a broader basket of currencies and a lower 57% against the real value of the dollar.
Export prices posted a 0.1% increase following the 0.7% drop in November, revised from -0.9%.
| Import/Export Prices (NSA) | Dec | Nov | Y/Y | 2005 | 2004 | 2003 |
|---|---|---|---|---|---|---|
| Import - All Commodities | -0.2% | -1.8% | 7.9% | 7.5% | 5.6% | 2.9% |
| Petroleum | -0.9% | -9.2% | 42.5% | 37.7% | 30.5% | 21.0% |
| Non-petroleum | 0.0% | 0.1% | 2.4% | 2.7% | 2.6% | 1.1% |
| Export - All Commodities | 0.1% | -0.7% | 2.7% | 3.2% | 3.9% | 1.6% |
by Tom Moeller January 12, 2006
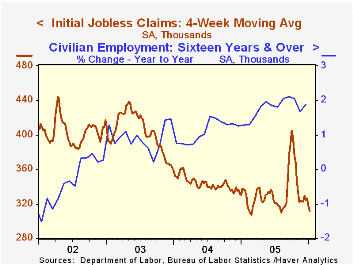
Initial claims for unemployment insurance increased 17,000 to 309,000 last week following a little revised 34,000 decline the week prior. Consensus expectations had been for 315,000 claims.
During the last ten years there has been a (negative) 75% correlation between the level of initial jobless insurance claims and the m/m change in payroll employment.
The four-week moving average of initial claims fell sharply to 311,500 (-7.7% y/y).
Continuing unemployment insurance claims reversed most of the prior week's decline with a 12,000 increase.
The insured rate of unemployment remained at 2.1% for the fourth week.
| Unemployment Insurance (000s) | 01/07/06 | 12/31/05 | Y/Y | 2005 | 2004 | 2003 |
|---|---|---|---|---|---|---|
| Initial Claims | 309 | 292 | -12.0% | 332 | 343 | 402 |
| Continuing Claims | -- | 2,702 | 1.4% | 2,665 | 2,926 | 3,531 |
by Carol Stone January 12, 2006
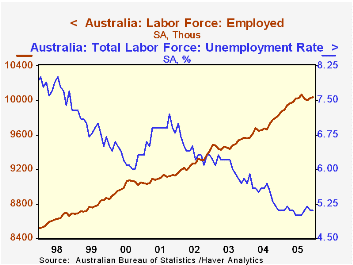
In December, employment in Australia rose a mere 2,100, and the unemployment rate was unchanged from November at 5.1%. Forecasts cited in one news service survey had looked for a 9,000 gain in employment and the 5.1% unemployment rate, so this report was disappointing, but only mildly so.
We last discussed Australian the labor market in September, covering August data. At that time, employment in Australia had risen continuously for a year, an extraordinary development in that economy, which generally shows more month-to-month variability. That variation appeared again immediately, as September's jobs fell by 42,400. October's fell again, as seen in the table below, but there was some gain in November before December's miniscule rise. Overall, though, 2005 put in a strong performance: the average number of people with jobs expanded 305,000, the largest annual gain since 1995.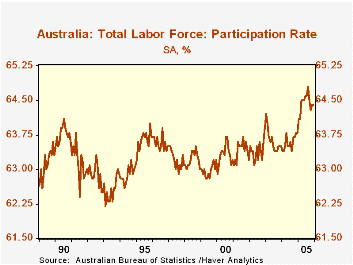
The job slowdown since the August peak has been accounted for almost entirely among male employees, 30,600 of whom lost jobs over the last four months. Female employees edged down only 1,300 on balance, with a decline in September and three monthly increases subsequently.
At the same time, the total unemployment rate touched a record low of 5.0% in August. The hesitation in employment over the last few months lifted the jobless rate to 5.2% in October, and it ended the year at 5.1%. The participation rate also edged off its record high of 64.8% in August, settling at 64.4% at year-end.
| Australia | Dec 2005 | Nov 2005 | Oct 2005 | Dec 2004 | Annual Averages||||
|---|---|---|---|---|---|---|---|---|
| 2005 | 2004 | 2003 | 2000 | |||||
| Employment (thous) | 10,033 | 10,031 | 10,002 | 9,822 | 9,987 | 9,682 | 9,482 | 8,989 |
| Monthly Change (thous/%) | 2 | 28 | -20 | 2.1 | 3.2 | 2.1 | 2.3 | 2.1* |
| Participation Rate (%) | 64.4 | 64.4 | 64.3 | 63.8 | 64.4 | 63.6 | 63.6 | 63.7** |
| Unemployment Rate (%) | 5.1 | 5.1 | 5.2 | 5.1 | 5.1 | 5.5 | 6.0 | 6.0** |

Tom Moeller
AuthorMore in Author Profile »Prior to joining Haver Analytics in 2000, Mr. Moeller worked as the Economist at Chancellor Capital Management from 1985 to 1999. There, he developed comprehensive economic forecasts and interpreted economic data for equity and fixed income portfolio managers. Also at Chancellor, Mr. Moeller worked as an equity analyst and was responsible for researching and rating companies in the economically sensitive automobile and housing industries for investment in Chancellor’s equity portfolio. Prior to joining Chancellor, Mr. Moeller was an Economist at Citibank from 1979 to 1984. He also analyzed pricing behavior in the metals industry for the Council on Wage and Price Stability in Washington, D.C. In 1999, Mr. Moeller received the award for most accurate forecast from the Forecasters' Club of New York. From 1990 to 1992 he was President of the New York Association for Business Economists. Mr. Moeller earned an M.B.A. in Finance from Fordham University, where he graduated in 1987. He holds a Bachelor of Arts in Economics from George Washington University.
More Economy in Brief


