 Global| Jan 12 2010
U.S. Trade Deficit Increases WithEconomic Recovery
by:Tom Moeller
|in:Economy in Brief
Summary
Economic recovery hit the U.S. trade accounts with a double-whammy during November. It generated a 2.6% m/m rise in imports and it increased the international trade deficit to $36.4B which was the highest since January. The rise [...]
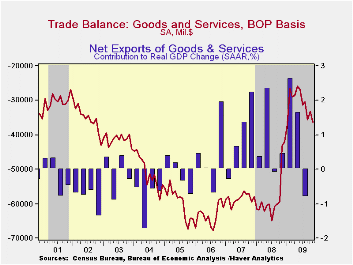 Economic
recovery hit the U.S. trade accounts with a double-whammy during
November. It generated a 2.6% m/m rise in imports and it increased the
international trade deficit to $36.4B which was the highest since
January. The rise followed October's deficit of $33.2B which
was revised up slightly from the initial estimate. Export growth lagged
with a 0.9% increase that followed two months of stronger increase. The
latest figure was quite a bit higher than Consensus expectations for a
deficit of $34.5B.
Economic
recovery hit the U.S. trade accounts with a double-whammy during
November. It generated a 2.6% m/m rise in imports and it increased the
international trade deficit to $36.4B which was the highest since
January. The rise followed October's deficit of $33.2B which
was revised up slightly from the initial estimate. Export growth lagged
with a 0.9% increase that followed two months of stronger increase. The
latest figure was quite a bit higher than Consensus expectations for a
deficit of $34.5B.
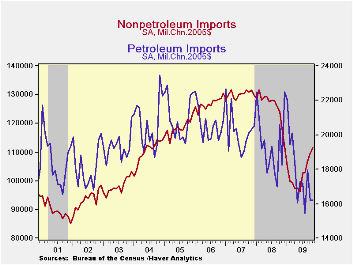
Imports rose 2.6% in part due to a rise in crude
oil prices to $72.54 per barrel which was the highest level since
October of 2008. Overall, however, the gain in petroleum imports was
held back by a 4.6% m/m decline (-8.2% y/y) in the quantity of
energy-related products. U.S. economic recovery continued to be
apparent in a 1.5% increase (-6.3% y/y) in real nonoil imports which
was the fifth increase in six months. Real non-auto capital goods
imports jumped 3.5% (-13.0% y/y) after a 2.8% September rise. Real
nonauto consumer goods imports surged 3.7% and by 12.5% since June.
 These are turnarounds from
earlier sharp declines. Real automotive
vehicles & parts imports, however, slipped 0.4% (-0.1% y/y) but
they were up by one-half since the spring. Real capital goods imports
also have been strong and rose 3.6% for the fourth increase in five
months. They have risen 14.5% since June. Finally, services imports
rose a modest 0.3% (-4.0% y/y) for the fifth increase in six months.
U.S. travels abroad were discouraged by the lower dollar. Travel
imports slipped 0.9% (-7.1% y/y and passenger fares rose 1.5% (-25.6%
y/y).
These are turnarounds from
earlier sharp declines. Real automotive
vehicles & parts imports, however, slipped 0.4% (-0.1% y/y) but
they were up by one-half since the spring. Real capital goods imports
also have been strong and rose 3.6% for the fourth increase in five
months. They have risen 14.5% since June. Finally, services imports
rose a modest 0.3% (-4.0% y/y) for the fifth increase in six months.
U.S. travels abroad were discouraged by the lower dollar. Travel
imports slipped 0.9% (-7.1% y/y and passenger fares rose 1.5% (-25.6%
y/y).
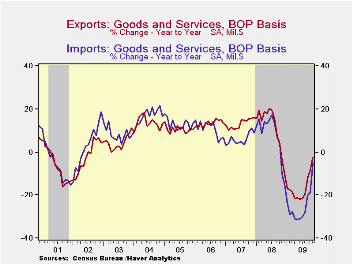
Reflecting the competitive value of the dollar, nominal exports rose 0.9% m/m and by 13.6% from the April low. Adjusted for price inflation, however, the gain is more impressive. Though real merchandise exports slipped 0.6% during November (-4.4% y/y), they have risen 13.9% since April. Offsetting a 5.4% decline (-2.3% y/y) decline in real non-auto consumer goods exports was a 9.0% rise in auto exports (-6.1% y/y) and a 0.4% uptick (-7.6% y/y) uptick in real capital goods exports. Exports of services ticked up 0.2% (-0.8% y/y) following earlier strong monthly gains.
 By
country, the trade deficit
with mainland China lessened to $20.2B, its least since June, as
exports rose 41.4% y/y and imports fell 2.5%. With Japan, the trade
deficit deteriorated to $5.4B from 5.1B one year earlier as exports
fell 16.3% while imports fell just 4.4%. With the European Union, the
trade deficit deteriorated to $6.4B as exports declined 9.4% y/y and
imports fell a lesser 5.3%.
By
country, the trade deficit
with mainland China lessened to $20.2B, its least since June, as
exports rose 41.4% y/y and imports fell 2.5%. With Japan, the trade
deficit deteriorated to $5.4B from 5.1B one year earlier as exports
fell 16.3% while imports fell just 4.4%. With the European Union, the
trade deficit deteriorated to $6.4B as exports declined 9.4% y/y and
imports fell a lesser 5.3%.
The international trade data can be found in Haver's USECON database. Detailed figures are available in the USINT database.
The Determinants of International Flows of U.S. Currency from the Federal Reserve Bank of New York can be found here.
| Foreign Trade | November | October | September | Y/Y | 2008 | 2007 | 2006 |
|---|---|---|---|---|---|---|---|
| U.S. Trade Deficit | $36.4 | $33.2 | $35.7B | $43.2B (11/08) | $695.9 | $701.4 | $760.4 |
| Exports - Goods & Services | 0.9% | 2.7% | 2.8% | -2.3% | 11.2% | 13.2% | 13.3% |
| Imports - Goods & Services | 2.6% | 0.7% | 5.6% | -5.5% | 7.6 | 6.0% | 10.8% |
| Petroleum | 7.3% | -10.6% | 20.7% | 1.0% | 37.0% | 9.4% | 20.1% |
| Nonpetroleum Goods | 2.4% | 3.2% | 4.2% | -6.9% | 1.5% | 4.8% | 9.1% |
by Tom Moeller January 12, 2010
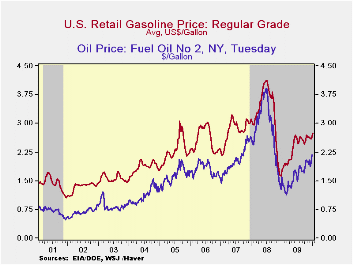 Energy
prices are responding to evidence of economic recovery. Last week the pump
price for regular gasoline rose to $2.75 per gallon, the
highest level since October 2008 and up 71% from the December 2008 low
of $1.61. Yesterday, strength in gasoline prices eased somewhat. The
spot market price for a gallon of regular gasoline held at $2.12 per
gallon, the same as last week's level. The figures are reported by the
U.S. Department of Energy and can be found in Haver's WEEKLY
& DAILY databases.
Energy
prices are responding to evidence of economic recovery. Last week the pump
price for regular gasoline rose to $2.75 per gallon, the
highest level since October 2008 and up 71% from the December 2008 low
of $1.61. Yesterday, strength in gasoline prices eased somewhat. The
spot market price for a gallon of regular gasoline held at $2.12 per
gallon, the same as last week's level. The figures are reported by the
U.S. Department of Energy and can be found in Haver's WEEKLY
& DAILY databases.
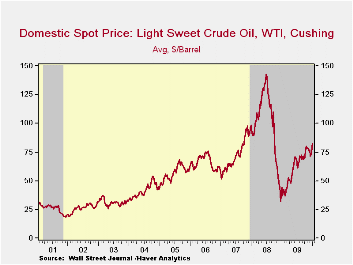
Earlier gains in the price for a barrel of light sweet crude (WTI) oil also stabilized. Yesterday, the spot price of $82.52 was roughly unchanged from the prior week. Nevertheless, prices have risen from $71.53 averaged in early-December. Moreover, prices were up sharply from the December 2008 low of $32.37.
Demand for gasoline last week posted a 0.9% decline versus one year ago. That decline compared to a 3.9% increase at the beginning of October. Breaking away from earlier y/y strength, the demand for residual fuel oil fell a sharp 50.4% y/y while distillate demand fell 10.9% y/y, a decline more moderate than the 21.6% y/y shortfall at the beginning of last July. Inventories of crude oil and petroleum products fell in early-January by 6.2% from the July high and were up a diminished 3.1% from one year ago.
Reflecting the cold temperatures throughout the U.S. natural gas prices also strengthened significantly. Last week prices averaged $6.50 per mmbtu (11.1% y/y), up from $3.35 in November and triple the September low. Nevertheless, prices remained down by half from the high reached in early-July of 2008 of $13.19/mmbtu.
The energy price data can be found in Haver's WEEKLY database while the daily figures are in DAILY. The gasoline demand figures are in OILWKLY.
The Case for "Inflation First" Monetary Policy from the Federal Reserve Bank of St. Louis is available here
| Weekly Prices | 01/11/10 | 01/04/10 | 12/28/09 | Y/Y | 2008 | 2007 | 2006 |
|---|---|---|---|---|---|---|---|
| Retail Regular Gasoline ($ per Gallon, Regular) | 2.75 | 2.67 | 2.61 | 54.2% | 3.25 | 2.80 | 2.57 |
| Light Sweet Crude Oil, WTI ($ per bbl.) | 82.59 | 79.14 | 75.09 | 85.6% | 100.16 | 72.25 | 66.12 |
by Tom Moeller January 12, 2010
 The
holiday
spirit faded last week. That was reflected in a 3.0% w/w decline in
chain store sales which left purchases at the lowest level since March
of last year. Nevertheless, sales rose 1.7% y/y. Most likely the latest
weakness as much reflects post-holiday price discounts as a decline in
sales' volume.
The
ICSC-Goldman Sachs retail chain-store sales index is constructed using
the same-store sales (stores open for one year) reported by 78 stores
of seven retailers: Dayton Hudson, Federated, Kmart, May, J.C. Penney,
Sears and Wal-Mart.During the last ten years
there has been a 69% correlation between the year-to-year growth in
chain store sales and the growth in general merchandise retail sales.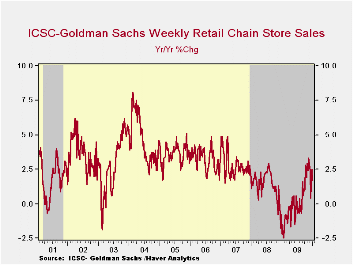 The weekly figures are available in Haver's SURVEYW
database.
The weekly figures are available in Haver's SURVEYW
database.
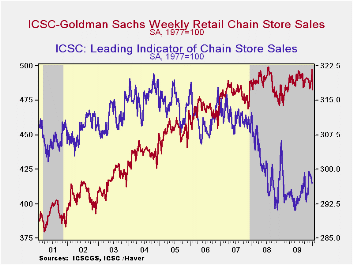
Also suffering from post-Holiday blues was the leading indicator of chain store sales. It slipped marginally early in January but its level was near the highest since January of last year. This composite leading economic indicator is compiled from four series: (1) the MBA's volume index of mortgage applications for home purchase (2) the ABC News/Money magazine's survey of consumer buying conditions (3) new filings for jobless benefits and (4) the 30-year government bond yield
| ICSC-UBS (SA, 1977=100) | 01/09/10 | 01/02/10 | 12/26/09 | Y/Y | 2009 | 2008 | 2007 |
|---|---|---|---|---|---|---|---|
| Total Weekly Chain Store Sales | 482.6 | 497.6 | 490.1 | 1.7% | 0.1% | 1.4% | 2.8% |
by Louise Curley January 12, 2010
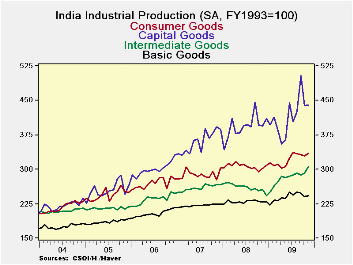
 Industrial
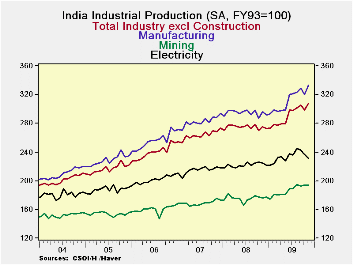
production in India increased 3.0% from 298.8 (FY 1993=100) in October
to 307.8 in November and was 11.7% greater than November
2008. This follows October's year over year increase of
10.4%. The production of electricity was down 1.7% for the
month but was 3.3% above the year ago level. Mining
production increased less than a third of a percent in November but was
almost 10 above the year ago level. Production in the
manufacturing sector was strong, increasing 4.2% in the month and 12.7%
over a year ago. The trends in total production and its major
components over the past six years are shown in the first
chart. The rising trend in production halted in 2008 and
early 2009, but never actually reversed into a decline.
Industrial
production in India increased 3.0% from 298.8 (FY 1993=100) in October
to 307.8 in November and was 11.7% greater than November
2008. This follows October's year over year increase of
10.4%. The production of electricity was down 1.7% for the
month but was 3.3% above the year ago level. Mining
production increased less than a third of a percent in November but was
almost 10 above the year ago level. Production in the
manufacturing sector was strong, increasing 4.2% in the month and 12.7%
over a year ago. The trends in total production and its major
components over the past six years are shown in the first
chart. The rising trend in production halted in 2008 and
early 2009, but never actually reversed into a decline.
Industrial production for India is also reported for Market Groups, some of which are shown in the second chart. (Recent levels and percentage changes for those market groups not shown in the chart are shown in the table below.) Production of consumer durables was a standout in November with production up 14.0%. A steadily increasing rate of production has brought the production of consumer durable goods 37.4% above that of November 2008 Although capital goods production increased only 0.39% in the month of November it was 11.6% greater than in November 2008. There was a similar pattern in the production of Intermediate Goods, which increased 1.5% in November but was 19.4% above the year ago level.
Rising industrial production in the first two months of the fourth quarter bodes well for growth in the total economy in the fourth quarter. Industrial production has accounted for between 18% and 20% of GDP over the past six years as shown in the third chart.
| Industrial Production (FY1993=100) | Nov 09 | Oct 09 | Nov 08 | M/M % Chg | Y/Y % Chg | 2008 | 2007 | 2006 |
|---|---|---|---|---|---|---|---|---|
| Total | 307.8 | 298.8 | 275.5 | 3.01 | 11.72 | 275.0 | 263.3 | 239.6 |
| Mining | 194.0 | 193.4 | 176.6 | 0.31 | 9.85 | 175.5 | 169.2 | 159.9 |
| Manufacturing | 333.0 | 319.7 | 295.5 | 4.16 | 12.69 | 294.9 | 282.0 | 255.0 |
| Electricity | 232.2 | 236.7 | 224.7 | -1.69 | 3.34 | 222.1 | 214.1 | 201.5 |
| Basic Goods | 243.3 | 241.7 | 229.5 | 0.66 | 6.01 | 229.5 | 221.2 | 203.5 |
| Capital Goods | 440.1 | 438.4 | 394.5 | 0.39 | 11.56 | 392.7 | 359.6 | 300.5 |
| Intermediate Goods | 305.7 | 291.7 | 256.0 | 1.46 | 19.41 | 260.8 | 259.7 | 234.7 |
| Consumer Goods | 335.4 | 329.2 | 302.2 | 1.88 | 10.99 | 306.4 | 288.3 | 269.6 |
| Durable | 516.9 | 453.3 | 376.1 | 14.03 | 37.44 | 389.7 | 377.9 | 378.5 |
| Nondurable | 294.4 | 298.0 | 286.0 | -1.21 | 2.94 | 287.3 | 267.7 | 244.4 |

Tom Moeller
AuthorMore in Author Profile »Prior to joining Haver Analytics in 2000, Mr. Moeller worked as the Economist at Chancellor Capital Management from 1985 to 1999. There, he developed comprehensive economic forecasts and interpreted economic data for equity and fixed income portfolio managers. Also at Chancellor, Mr. Moeller worked as an equity analyst and was responsible for researching and rating companies in the economically sensitive automobile and housing industries for investment in Chancellor’s equity portfolio. Prior to joining Chancellor, Mr. Moeller was an Economist at Citibank from 1979 to 1984. He also analyzed pricing behavior in the metals industry for the Council on Wage and Price Stability in Washington, D.C. In 1999, Mr. Moeller received the award for most accurate forecast from the Forecasters' Club of New York. From 1990 to 1992 he was President of the New York Association for Business Economists. Mr. Moeller earned an M.B.A. in Finance from Fordham University, where he graduated in 1987. He holds a Bachelor of Arts in Economics from George Washington University.
More Economy in Brief


