 Global| Jun 10 2008
U.S. Trade Deficit Deeper in April, Prior Deficits Revised Shallower
by:Tom Moeller
|in:Economy in Brief
Summary
The U.S. foreign trade deficit deepened to $60.9B in April. A $59.7B figure had been generally expected and March's deficit was revised shallower to $56.5B. Benchmark revisions to the seasonally adjusted figures back to 2005, and the [...]
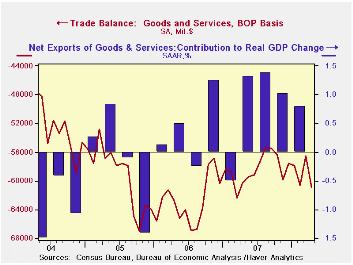
The U.S. foreign trade deficit deepened to $60.9B in April. A $59.7B figure had been generally expected and March's deficit was revised shallower to $56.5B. Benchmark revisions to the seasonally adjusted figures back to 2005, and the not seasonally adjusted data to 2007, generally lowered the trade deficit. Exports were revised up slightly due to raised estimates for services.
U.S. exports rebounded 3.3% in April following their 1.9% March decline. At an annual rate exports during the last three months rose 15.0%. While that was improved from 13.0% growth last year, it actually is down from 32.3% growth last summer.
Goods exports surged 4.5% in April and in chained dollars they
also jumped by 4.5% (11.3% y/y). That recovered virtually all of the
4.7% March decline. Chained dollar exports of nonauto consumer goods
bounced back after March's decline and surged 6.1% (10.0% y/y). Exports
of capital goods more than recovered the prior month's drop with a 5.5%
(13.9% y/y) pop as exports of civilian aircraft (in nominal terms)
surged 23.8% (33.0% y/y). That rise did not, however, recover declines
during the prior several months. Nominal exports of computers also
surged 13.9% (20.6% y/y).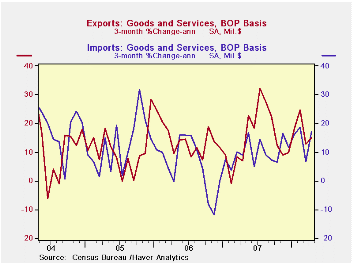
Exports of services rose 0.9% (17.0% y/y) as travel exports rose 0.7% (19.5% y/y) and passenger fares rose 1.0% (25.4% y/y).
Higher oil prices again raised petroleum imports in April by
12.1%. Adjusted for those higher prices, however, petroleum imports
rose just 3.9% (-4.2% y/y) and for all of this year so far the volume
is down 2.6% from the annual peak for all of 2005. The average cost for
a barrel of crude oil was $96.81 in April.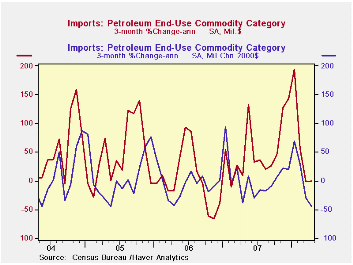
Month-to-month, a 3.5% rise in imports of nonpetroleum products recovered the prior month's decline. However, measured in chained 2000 dollars these imports rose only 2.6% after a 4.0% March drop and the y/y gain was barely positive following a reduced 2.6% increase in 2007. Also in chained dollars, imports of capital goods rose 2.7% (6.5% y/y), about equal to last year's full year growth. Chained imports of nonauto consumer goods did rise 1.6% but they were down 0.3% from last April. Real imports of automotive vehicles & parts surged 4.6% but they were down 3.0% from last year.
Services imports nudged up 0.9% (10.2% y/y). Travel imports increased 0.8% (11.1% y/y) and passenger fares increased 1.6% (19.9% y/y).
With China, the U.S. trade deficit in goods deteriorated sharply m/m to $20.3B. That was the deepest deficit since January, but so far this year the U.S. trade deficit with China averaged $18.7B per month versus a $21.2B monthly average last year. Exports to China rose in April 19.4% y/y and imports rose a moderate 6.9% which, due to slower U.S. economic growth, is down from an 11.7% increase last year. Imports from China rose 18.2% in 2006 and the annual gains exceeded 20% back to 2003.
Outstanding Issues in the Analysis of Inflation is yesterday's speech by Fed Chairman Ben S. Bernanke and it is available here.
| Foreign Trade | April | March | Y/Y | 2007 | 2006 | 2005 |
|---|---|---|---|---|---|---|
| U.S. Trade Deficit | $60.9B | $56.5B | $60.3B (4/07) | $700.3 | $753.3 | $711.6B |
| Exports - Goods & Services | 3.3% | -1.9% | 19.2% | 13.0% | 13.5% | 10.6% |
| Imports - Goods & Services | 4.5% | -3.3% | 13.5% | 6.1% | 10.8% | 12.8% |
| Petroleum | 12.1% | -7.5% | 55.8% | 9.4% | 20.1% | 39.6% |
| Nonpetroleum Goods | 3.5% | -3.0% | 6.0% | 4.8% | 9.1% | 10.3% |
by Tom Moeller June 10, 2008
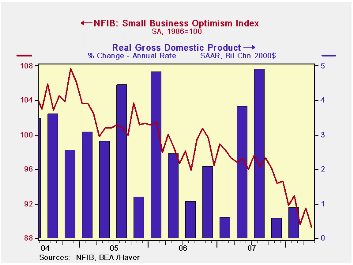
Small business optimism, according to the National Federation of Independent Business (NFIB), fell 2.4% in June and reversed its May rise. The decline to 89.3 dropped optimism to the lowest level since January 1975, its second lowest level on record.
During the last ten years there has been a 70% correlation between the level of the NFIB index and the two quarter change in real GDP.
Twelve percent fewer respondents expected the economy to improve and only two percent were planning to raise employment, the least since early-2003. Only fifteen percent had one or more job openings. During the last ten years there has been a 71% correlation between the NFIB employment percentage and the y/y change in nonfarm payrolls.
Eight percent of firms indicated that credit was harder to get, near the highest level since 1993 and that was more than double the percentage during 2004.
A much reduced four percent of respondents thought that now was a good time to expand the business, the least since 1982, but 28% of respondents expected lower earnings, near the recent low.
The percentage of firms actually raising prices again rose m/m, to 23% which was the highest level since July of 2006. During the last ten years there has been a 64% correlation between the y/y change in the producer price index and the level of the NFIB price index. The percentage of firms planning to raise prices also rose to 32%, its highest since late-2005.
About 24 million businesses exist in the United States. Small business creates 80% of all new jobs in America.
The NFIB figures can be found in Haver's SURVEYS database.
Reducing Systemic Risk in a Dynamic Financial System is yesterday's speech by New York Fed President Timothy F. Geithner and it can be found here
| Nat'l Federation of Independent Business | May | April | Y/Y | 2007 | 2006 | 2005 |
|---|---|---|---|---|---|---|
| Small Business Optimism Index (1986=100) | 89.3 | 91.5 | -8.1% | 96.7 | 98.9 | 101.6 |
by Tom Moeller June 10, 2008
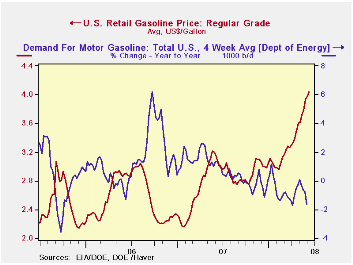
The retail price for a gallon of regular gasoline rose six cents last week to $4.04 per gallon, according to the U.S. Department of Energy survey. The rise followed the previous week's four cent increase. For all grades of gasoline the average price also rose six cents to an average $4.09 per gallon last week.
Yesterday, the spot market price for a gallon of regular
gasoline fell a nickel from Friday to $3.28 but that was still up four
cents from last week's average.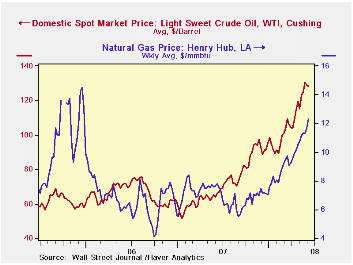
Weekly gasoline prices can be found in Haver's WEEKLY database, daily prices are in the DAILY database.
According to the U.S. Department of Energy the increase in gasoline prices, along with the slowdown in economic growth, have lowered the demand for gasoline during the latest four weeks by 1.6% from a year earlier. Refinery production of gasoline is down 3.9% year-to-year.
The DOE figures are available in Haver's OILWKLY database.
During all of last week, the price of a barrel of WTI crude oil slipped slightly to an average of $128.14 but yesterday the price held above $130 at $134.35.
Natural gas prices rose to the highest level since late-2005. At $12.715/mmbtu up 70.0% versus a year earlier.
| Weekly Prices | 06/09/08 | 06/02/08 | Y/Y | 2007 | 2006 | 2005 |
|---|---|---|---|---|---|---|
| Retail Regular Gasoline ($ per Gallon) | 4.04 | 3.98 | 31.3% | 2.80 | 2.57 | 2.27 |
| Light Sweet Crude Oil, WTI ($ per bbl.) | 128.47 | 130.15 | 100.9% | 72.25 | 66.12 | 56.60 |
by Tom Moeller June 10, 2008
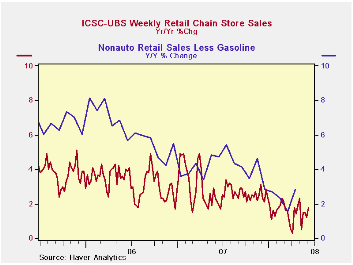
The International Council of Shopping Centers reported that chain store sales recovered 1.7% from the week earlier. The latest was the highest level in one month.
During all of May sales fell 0.9% from April; during which sales rose 1.0%.During the last ten years there has been a 45% correlation between the y/y change in chain store sales and the change in nonauto retail sales less gasoline.
The ICSC-UBS retail chain-store sales index is constructed using the same-store sales (stores open for one year) reported by 78 stores of seven retailers: Dayton Hudson, Federated, Kmart, May, J.C. Penney, Sears and Wal-Mart.
During the latest week, the leading indicator of chain store sales from ICSC-UBS rose 0.6%, its first increase since early April. from one year earlier.
The chain store sales figures are available in Haver's SURVEYW database.
| ICSC-UBS (SA, 1977=100) | 06/07/08 | 05/31/08 | Y/Y | 2007 | 2006 | 2005 |
|---|---|---|---|---|---|---|
| Total Weekly Chain Store Sales | 492.3 | 484.3 | 1.8% | 2.8% | 3.3% | 3.6% |
by Louise Curley June 10, 2008
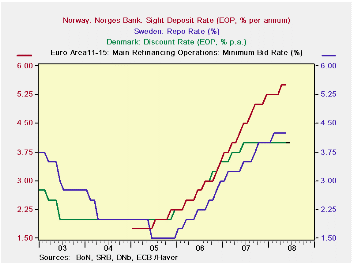
The Monetary policy of the Central Bank of Denmark has shadowed that of the European Central Bank while those of Sweden and Norway have tended to be tighter. Currently the official interest rate in Norway is 5.5% and in Sweden, 4.25%, while in Denmark and the Euro Area, it is 4%. The first chart plots the official interest rates of the three countries and the Euro Area. Denmark and the Euro Area have had identical official interest rates.
Current trends in inflation in the three countries will keep their central banks vigilant. The second chart shows the inflation rates in Denmark, Norway and Sweden. Inflation has been rising since early 2007, but with rising interest rates, real interest rates remain positive in contrast to the situation in the Far East where negative interest are the rule as monetary policy has continued easy in the face of rising inflation. (See June 2nd Commentary "Far East Inflation and Easy Monetary Policy Mean Negative Real Interest Rates in the Area.")
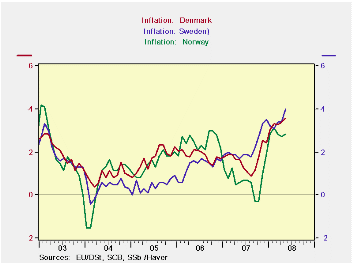
| INFLATION (%) | May 08 | Apr 08 | May 07 | M/M Chg | Y/Y Chg | 2007 | 2006 | 2005 |
|---|---|---|---|---|---|---|---|---|
| Denmark | 3.56 | 3.38 | 1.60 | 0.18 | 1.89 | 1.67 | 1.85 | 1.70 |
| Norway | 2.81 | 2.72 | 0.58 | 0.09 | 2.23 | 0.72 | 2.48 | 1.48 |
| Sweden | 4.0 | 3.4 | 1.7 | 0.6 | 2.3 | 2.21 | 1.36 | 0.45 |
| OFFICIAL INTEREST RATES EOP (%) | ||||||||
| Denmark | 4.00 | -- | -- | -- | -- | 4.00 | 4.0 | 2.25 |
| Norway | 5.50 | -- | -- | -- | -- | 5.25 | 3.50 | 2.25 |
| Sweden | 4.25 | -- | -- | -- | -- | 4.00 | 3.00 | 1.50 |
| ECB | 4.00 | -- | -- | -- | -- | 4.00 | 3.50 | 2.25 |
by Robert BruscaJune 10, 2008

Industrial output has held firm-to-strong in most of the large EMU countries in April. France shows strengthening IP trends. In Italy the three- and six- month growth rates are just above 2%. Spain’s numbers are simply too volatile to tell. They are on a strong upswing in April (see table) but only after showing some extreme weakness in their March trends (also in table). In the UK, output continues to edge higher. But Germany, surprisingly, shows the weakest trends in April. At -0.7%; Aprils 3-mo growth rate for Germany is now at -4.1% below the +3.3% six month pace and the +5.7% Yr/Yr pace.
This divergence points up the erratic and out of step nature of these economic trends. Germany alone shows a clear decelerating pattern for output but gives mixed signals for industry overall. Germany boasts still strong exports but also dropping production and fading – but still growing – industrial order books. And despite growth in industrial output in other EMU countries, German export orders were dropping the most in other EMU countries, too. So that is yet another mixed or inconsistent signal.
As the EMU’s largest economy Germany has supported growth in adjacent EMU members. For the time being, other EMU countries continue to register growth in April. Still, there is little sign of vigor. The European consumer is still struggling and we know that the strong euro, financial distress and spiking energy prices are continuing to take a toll. The capital goods sector continues to be the mainstay of growth in Europe. But growth overall seems to be challenged despite the spate of firm industrial output numbers reported out by the UK, Italy and France today. The risk is that Germany’s slowdown is the vanguard and weakness in the other countries will follow.
| Main E-zone Countries and UK IP in MFG | ||||||||||
|---|---|---|---|---|---|---|---|---|---|---|
| Mo/Mo | Apr 08 |
Mar 08 |
Apr 08 |
Mar 08 |
Apr 08 |
Mar 08 |
||||
| MFG Only | Apr 08 |
Mar 08 |
Feb 08 |
3Mo | 3Mo | 6mo | 6mo | 12mo | 12mo | Q-2- Date |
| Germany: | -0.7% | -0.3% | 0.0% | -4.1% | 3.6% | 3.3% | 4.4% | 5.7% | 5.0% | -5.4% |
| France: IP excl Construction | 1.4% | -1.0% | 0.5% | 3.4% | -0.8% | 0.8% | 1.9% | 3.2% | 0.7% | 5.4% |
| Italy | 0.6% | 0.0% | -0.1% | 2.1% | 7.0% | 2.1% | -1.2% | -0.1% | -1.8% | 3.6% |
| Spain | 27.0% | -16.9% | 2.6% | 37.5% | -40.3% | 10.9% | -20.4% | 11.5% | -13.8% | 106.3% |
| UK | 0.2% | -0.5% | 0.4% | 0.4% | 1.2% | 0.4% | 1.0% | 0.1% | 0.5% | 0.0% |

Tom Moeller
AuthorMore in Author Profile »Prior to joining Haver Analytics in 2000, Mr. Moeller worked as the Economist at Chancellor Capital Management from 1985 to 1999. There, he developed comprehensive economic forecasts and interpreted economic data for equity and fixed income portfolio managers. Also at Chancellor, Mr. Moeller worked as an equity analyst and was responsible for researching and rating companies in the economically sensitive automobile and housing industries for investment in Chancellor’s equity portfolio. Prior to joining Chancellor, Mr. Moeller was an Economist at Citibank from 1979 to 1984. He also analyzed pricing behavior in the metals industry for the Council on Wage and Price Stability in Washington, D.C. In 1999, Mr. Moeller received the award for most accurate forecast from the Forecasters' Club of New York. From 1990 to 1992 he was President of the New York Association for Business Economists. Mr. Moeller earned an M.B.A. in Finance from Fordham University, where he graduated in 1987. He holds a Bachelor of Arts in Economics from George Washington University.
More Economy in Brief


