 Global| Apr 13 2010
U.S. Trade Deficit DeepensSlightly With Rise In Imports
by:Tom Moeller
|in:Economy in Brief
Summary
After falling sharply into last autumn, the U.S. foreign trade deficit has bounced within a narrow range during the last four months. For February, the deficit deepened to $39.7B from a little-revised $37.0B during January. The latest [...]
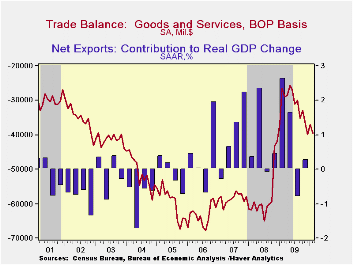
After falling sharply into last autumn, the U.S. foreign trade deficit has bounced within a narrow range during the last four months. For February, the deficit deepened to $39.7B from a little-revised $37.0B during January. The latest figure was slightly deeper than Consensus expectations for a deficit of $38.5B.
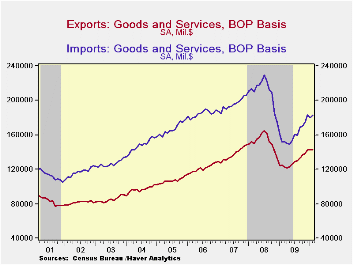
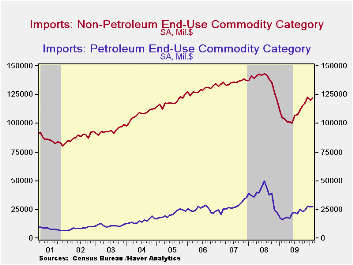
With a 1.7% increase, total imports reversed their January decline. The latest gain reflected a modest 1.6% increase (69.9% y/y) in imports of petroleum products as crude oil prices slipped m/m to $72.92 per barrel. Earlier gains in petroleum prices continued to effect a demand reaction. The quantity of petroleum imports fell 4.8% m/m and 6.7% y/y following declines during the prior three years.
Outside of oil, imports reversed most of their January decline with a 1.3% increase. Moreover, recovery in the U.S. economy has pulled real non-oil imports up 14.1% y/y following a 17.7% decline for all of last year. The increase has been led by imports of automotive vehicles & parts which surged by more-than one half y/y. Real nonauto consumer goods imports reversed their January decline with a 3.2% increase (10.0% y/y). Capital goods imports also recovered by 1.2% m/m and by 14.1% over the last twelve months. Finally, services imports increased a firm 3.3% (9.3% y/y). U.S. travels abroad recovered the January decline with a 1.1% increase (0.2% y/y). Passenger fares fell 1.1% (-6.1% y/y) for the second consecutive monthly drop but "other" transportation charges surged 4.0% (15.0% y/y).
Nominal exports posted a 0.2% uptick (14.3% y/y) and reversed a December slip. Real merchandise exports made up half on their January decline with a 0.8% increase and the 12.1% y/y gain remained near the strongest since early-2008. Real capital goods exports gained 1.2% (14.1% y/y) but auto exports fell for the second consecutive month (+57.0% y/y). Adding to the overall rise in exports was a 3.2% increase (10.0% y/y) in real exports of non-auto consumer goods. Exports of services ticked up just 0.5% but the y/y gain of 9.0% fully reversed the 2009 drop.
By country, the trade deficit with mainland China eased to $16.5B and the deficit is roughly half its peak of $27.9B in October of 2008. Exports to China rose by nearly one-half y/y while imports rose by one-quarter. With Japan, the trade deficit deepened to $4.3B as exports rose 9.8% but imports jumped by one-third. With the European Union, the trade deficit increased to $5.3B as exports fell 4.4% y/y and imports rose 5.3%.
| Foreign Trade | February | January | December | Y/Y | 2009 | 2008 | 2007 |
|---|---|---|---|---|---|---|---|
| U.S. Trade Deficit | $39.7 | $37.0B | $39.9B | $26.5B (2/09) | $378.6B | $695.9B | $701.4B |
| Exports - Goods & Services | 0.2% | -0.2% | 3.4% | 14.3% | -14.9% | 11.2% | 13.2% |
| Imports - Goods & Services | 1.7 | -1.8 | 4.9 | 20.5 | -23.4 | 7.6 | 6.0 |
| Petroleum | 1.6 | -3.6 | 15.1 | 69.9 | -44.1 | 37.0 | 9.4 |
| Nonpetroleum Goods | 1.3 | -1.8 | 3.8 | 16.2 | -21.0 | 1.5 | 4.8 |
by Tom Moeller April 13, 2010
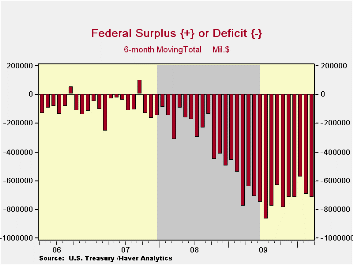
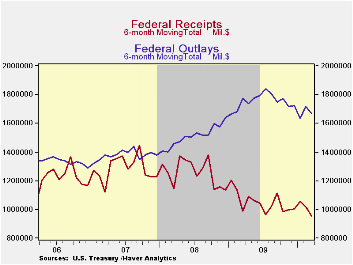
For March, the U.S. federal budget deficit eased enough to pull the deficit during the first six months of FY'10 to $717.0B versus $781.4B during the first six months of last fiscal year. According to the U.S. Treasury Department, the deficit of $65.4B compared to Consensus expectations of $62.0B.
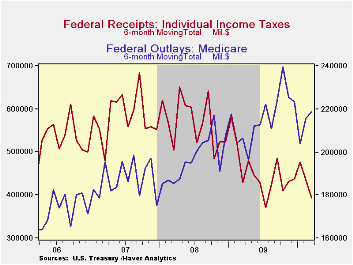
The hemorrhaging of Federal revenues due to the past recession eased with moderate economic recovery. Net revenues during the first six months of FY'10 fell 3.6% y/y versus declines near 20% last year. As the employment picture brightened, the decline in individual income tax receipts fell to 8.4% y/y through March versus a 14.7% decline during the first six months of FY '09. The decline in corporate tax receipts also eased sharply to 4.0% as corporate profits improved. Working the other way was a record 5.0% decline in social insurance taxes and contributions. Also, estate & gift taxes fell by nearly one-quarter, double the rate of decline during last fiscal year's first six months.
Overall outlays declined 5.7% during the first six months of FY'10 as outlays for the Troubled Asset Relief Program more-than reversed the February increase. Defense spending (19% of total outlays) rose by one-quarter y/y. Health spending (15% of total outlays) continued to trend higher but income security payments (11% of outlays) surged by one-quarter versus last year with higher unemployment. Growth in social security payments (21% of outlays) rose 4.0% and net-interest payments (5% of outlays) rose with higher rates. Medicare expenditures (12% of outlays) rose by two-thirds but other health care services spending (10% of outlays) fell modestly.
The Government's financial data are available in Haver's USECON database, with extensive detail available in the specialized GOVFIN.
Public Opinion on Taxes from the American Enterprise Institute can be found here.
| US Government Finance | March | FY 'YTD | FY 'YTD | FY 2009 | FY 2008 | FY 2007 |
|---|---|---|---|---|---|---|
| Budget Balance | $-65.4B | $-717.0B | -- | $-1,417.1B | $-454.8B | $-161.5B |
| Net Revenues | $153.4B | $953.9B | -3.6% | -16.6% | -1.7% | 6.7% |
| Net Outlays | $218.7B | $1,670.9B | 5.7% | 18.2% | 9.1% | 2.8% |
by Tom Moeller April 13, 2010
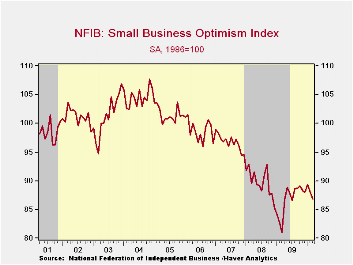
Economic recovery continued to do little to bolster small businesses' mood. The National Federation of Independent Business (NFIB) reported their March small business optimism index fell m/m to 86.8 which the lowest level since July of last year. During the last ten years there has been an 85% correlation between the level of the NFIB index and the two-quarter change in real GDP.
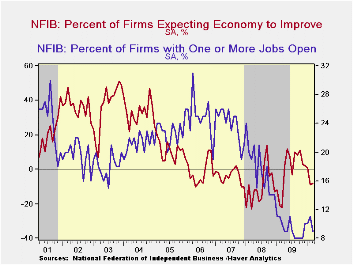
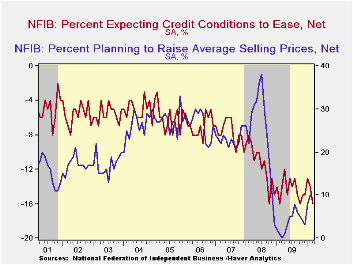
Weaker figures on employment led the deterioration in last month's overall reading. The percent of firms with one or more job openings fell to its lowest since November and slightly fewer firms were planning to increase employment. Expectations for overall economic improvement remained near its lowest level since March of last year as a majority of firms saw further economic deterioration. Expectations for sales in six months fell back into negative territory and the percentage thinking that now was a good time to expand the business fell sharply to its lowest since in twelve months. Expectations for an easing of credit market conditions remained near the lowest since the Fall of 2008. The primary source of strength behind the numbers was that the percent of firms planning to raise inventory levels remained at the highest since early last year.
Hiring plans remain restrained. The percentage of firms with one or more job openings fell back to near the series' low and the percentage planning to increase hiring deteriorated. During the last ten years there has been a 74% correlation between the NFIB employment percentage and the six-month change in nonfarm payrolls.
On the pricing front weakness continued. The percentage of firms actually raising prices slipped to -20% (indicating deflation) and remained near the record low. During the last ten years there has been a 51% correlation between the six-month change in the producer price index and the level of the NFIB price index.Also, the percentage of firms planning to raise prices slipped from its highest level since late-2008. Finally, the percentage planning to raise worker compensation reversed half of its February improvement and fell to 3%.
The most important problems seen by business were poor sales (34%), taxes (a reduced 19%), government requirements (11%), insurance cost & availability (9%), competition from large businesses (a reduced 5%) and inflation (an increased 5%).
About 24 million small businesses exist in the United States. Small business creates 80% of all new jobs in America and the NFIB figures can be found in Haver's SURVEYS database.
| Nat'l Federation of Independent Business | March | February | January | March '09 | 2009 | 2008 | 2007 |
|---|---|---|---|---|---|---|---|
| Small Business Optimism Index (SA, 1986=100) | 86.8 | 88.0 | 89.3 | 81.0 | 86.7 | 89.8 | 96.7 |
| Percent of Firms Expecting Economy To Improve | -8 | -9 | 1 | -22 | -0 | -10 | -4 |
| Percent of Firms With One or More Job Openings | 9 | 11 | 10 | 10 | 9 | 18 | 24 |
| Percent of Firms Reporting That Credit Was Harder To Get | 15 | 12 | 14 | 12 | 14 | 9 | 6 |
| Percent of Firms Raising Avg. Selling Prices (Net) | -20 | -21 | -18 | -23 | -20 | 17 | 15 |
by Louise Curley April 13, 2010
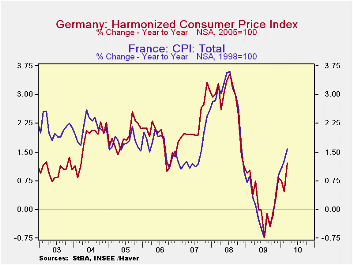
Inflation, as measured by the year over year percentage change in the Consumer Price Index, accelerated in France and Germany in March as can be seen in the first chart.
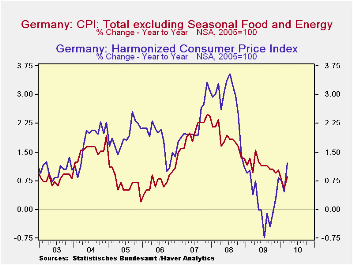
Inflation in Germany increased to 1.21% in March, up from 0.47% in February. The sharp increase was due largely to the rise in energy and fresh food prices. "Core" inflation, which excludes these items, rose 0.85% in March compared with a rise of 0.57% in February. The March rise in Core inflation was surprising and somewhat worrisome in view of its generally downward trend since July, 2008 when it reached 3.54%. Overall and core inflation for Germany are shown in the second chart.
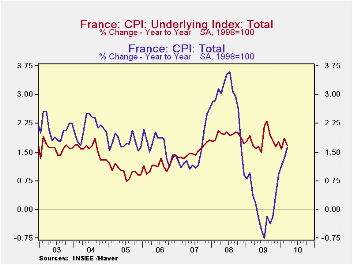
Inflation in France rose 1.58% in March, compared with a 1.28% in February. "Core" inflation in France, however, declined from 1.85% in February to 1.68% in March in contrast to Germany's rise. France publishes a seasonally adjusted "underlying index", ISJ (Index Sous Jacent) that excludes the prices of fresh products, energy, tobacco and public service tariffs. Core inflation in France has tended to be some 100 basis points higher than that in Germany, as can be seen in the following table. Overall and core inflation in France are shown in the second chart.
| Year over Year % Change | Mar 10 | Feb 10 | Jan 10 | Dec 09 | Nov 09 | Oct 09 | Sep 09 | Aug 09 |
|---|---|---|---|---|---|---|---|---|
| Germany | ||||||||
| Consumer Price Index | 1.21 | 0.47 | 0.75 | 0.84 | 0.28 | -0.09 | -0.40 | -0.09 |
| CPI ex food and energy | 0.85 | 0.57 | 0.76 | 1.04 | 0.95 | 1.05 | 1.05 | 1.14 |
| France | ||||||||
| Consumer Price Index | 1.58 | 1.28 | 1.10 | 0.91 | 0.39 | -0.21 | -0.36 | -0.18 |
| Core Index (ISJ) | 1.68 | 1.85 | 1.57 | 1.76 | 1.65 | 1.79 | 1.95 | 2.31 |

Tom Moeller
AuthorMore in Author Profile »Prior to joining Haver Analytics in 2000, Mr. Moeller worked as the Economist at Chancellor Capital Management from 1985 to 1999. There, he developed comprehensive economic forecasts and interpreted economic data for equity and fixed income portfolio managers. Also at Chancellor, Mr. Moeller worked as an equity analyst and was responsible for researching and rating companies in the economically sensitive automobile and housing industries for investment in Chancellor’s equity portfolio. Prior to joining Chancellor, Mr. Moeller was an Economist at Citibank from 1979 to 1984. He also analyzed pricing behavior in the metals industry for the Council on Wage and Price Stability in Washington, D.C. In 1999, Mr. Moeller received the award for most accurate forecast from the Forecasters' Club of New York. From 1990 to 1992 he was President of the New York Association for Business Economists. Mr. Moeller earned an M.B.A. in Finance from Fordham University, where he graduated in 1987. He holds a Bachelor of Arts in Economics from George Washington University.
More Economy in Brief


