 Global| Oct 14 2004
U.S. Trade Deficit Deepened in August
by:Tom Moeller
|in:Economy in Brief
Summary
In August, the U.S. foreign trade deficit deepened to $54.0B, the second highest level on record. Prior months' figures were little revised. Consensus expectations had been for a somewhat shallower deficit of $51.0B. Total exports [...]
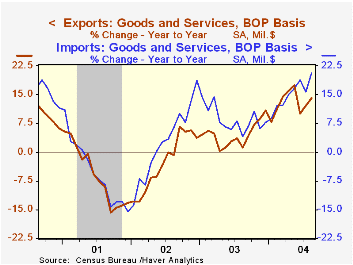
In August, the U.S. foreign trade deficit deepened to $54.0B, the second highest level on record. Prior months' figures were little revised. Consensus expectations had been for a somewhat shallower deficit of $51.0B.
Total exports grew just 0.1%, held back by a 0.1% (+15.7% y/y) decline in goods exports which followed a 4.3% pop in July. The m/m decline in goods exports spread from a 4.5% (-5.3% y/y) drop in foods & beverages to a 2.2% (+19.8%) fall in industrial supplies and a 2.0% (+3.5%) drop in the "other" category.
Capital goods exports ticked up 0.2% (+15.4% y/y) following a 5.2% jump in July while nonauto consumer goods exports rose by 4.1% (15.0% y/y), the first m/m increase following four months of decline. Auto exports also rose a strong 3.1% (22.7% y/y).
A 13.5% m/m (36.7% y/y) rise in the value of petroleum imports drove total imports 2.5% higher in August. Most of that gain reflects higher crude oil prices which are up 32.0% y/y, but the quantity of petroleum product imports did rise 5.3% (8.0% y/y). Imports of non-petroleum goods rose 0.4% (15.7% y/y) following a 0.4% decline in July.
The US trade deficit with China deepened to another record of $15.4.0B ($124.1B in 2003). Year over year, the gain in exports to China (31.8%) and imports from China (31.3% y/y) was roughly equal. The US trade deficit with Japan eased to $6.44B ($66.0B in 2003) as did the deficit with the European Union which eased to $9.6B ($27.9B in 2003).
"Free Trade: Why Are Economists and Noneconomists So Far Apart?" from the Federal Reserve Bank of St. Louis is available here.
"Offshoring in the Service Sector: Economic Impact and Policy Issues" from the Federal Reserve Bank of Kansas City can be found here.
| Foreign Trade | Aug | July | Y/Y | 2003 | 2002 | 2001 |
|---|---|---|---|---|---|---|
| Trade Deficit | $54.0B | $50.5B | $40.2B(8/03) | $496.5B | $421.7B | $362.7B |
| Exports - Goods & Services | 0.1% | 3.0% | 14.2% | 4.6% | -3.1% | -6.0% |
| Imports - Goods & Services | 2.5% | -1.1% | 20.7% | 8.5% | 2.1% | -5.5% |
by Tom Moeller October 14, 2004
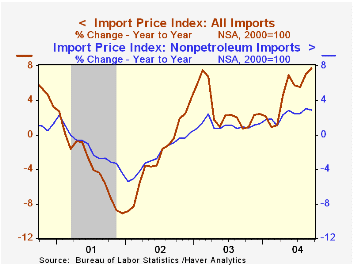
Import prices rose a modest 0.2% last month, just half the Consensus expectation. The prior month's surge of 1.7% was a bit lower than initially estimated due to a downwardly revised 0.3% gain in non-petroleum prices.
In September, non-petroleum import prices ticked up just 0.1%. Capital goods prices were unchanged (-1.4% y/y) for the sixth month this year. Excluding computers capital goods prices also were unchanged (+1.5% y/y). Non-auto consumer goods prices similarly were unchanged (+0.6% y/y) and have been flat or down in each of the last seven months due to lower durables prices.
Petroleum prices added 0.6% to the 8.3% August spike. The price of Brent crude oil in October has pushed above $50 per barrel versus the September average of $43.41.
During the last ten years there has been a (negative) 55% correlation between the level of the dollar and the y/y change in nonpetroleum import prices.
Export prices rose 0.4% due to a 1.6% (2.2% y/y) spike in agricultural prices. Nonagricultural prices rose a moderate 0.2% (4.3% y/y).
"Measuring the Costs of Exchange Rate Volatility" from the Federal Reserve Bank of San Francisco can be found here.
| Import/Export Prices (NSA) | Sept | Aug | Y/Y | 2003 | 2002 | 2001 |
|---|---|---|---|---|---|---|
| Import - All Commodities | 0.2% | 1.4% | 7.8% | 2.9% | -2.5% | -3.5% |
| Petroleum | 0.6% | 8.3% | 48.7% | 21.0% | 3.0% | -17.2% |
| Non-petroleum | 0.1% | 0.3% | 2.9% | 1.1% | -2.4% | -1.5% |
| Export - All Commodities | 0.4% | -0.5% | 4.0% | 1.6% | -1.0% | -0.8% |
by Tom Moeller October 14, 2004
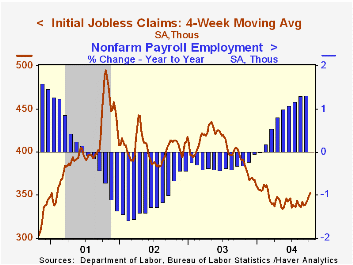
Initial claims for unemployment insurance rose 15,000 last week to 352,000 after a 35,000 decline the prior week that was little revised. Consensus expectations had been for 345,000 claims.
The increase may have reflected aberrant seasonal adjustment factors.
The 4-week moving average of initial claims rose to 353,000 (-9.7% y/y). During the last ten years there has been an 81% (negative) correlation between the monthly average of initial claims and the y/y change in payroll employment.
Ongoing claims for unemployment insurance continued lower by 11,000 following a decline the prior week that was revised deeper to 9,000.
The insured rate of unemployment remained at 2.3% where it has hovered since the end of April.
| Unemployment Insurance (000s) | 10/09/04 | 10/02/04 | Y/Y | 2003 | 2002 | 2001 |
|---|---|---|---|---|---|---|
| Initial Claims | 352 | 337 | -9.0% | 402 | 404 | 406 |
| Continuing Claims | -- | 2,845 | -20.4% | 3,531 | 3,570 | 3,018 |

Tom Moeller
AuthorMore in Author Profile »Prior to joining Haver Analytics in 2000, Mr. Moeller worked as the Economist at Chancellor Capital Management from 1985 to 1999. There, he developed comprehensive economic forecasts and interpreted economic data for equity and fixed income portfolio managers. Also at Chancellor, Mr. Moeller worked as an equity analyst and was responsible for researching and rating companies in the economically sensitive automobile and housing industries for investment in Chancellor’s equity portfolio. Prior to joining Chancellor, Mr. Moeller was an Economist at Citibank from 1979 to 1984. He also analyzed pricing behavior in the metals industry for the Council on Wage and Price Stability in Washington, D.C. In 1999, Mr. Moeller received the award for most accurate forecast from the Forecasters' Club of New York. From 1990 to 1992 he was President of the New York Association for Business Economists. Mr. Moeller earned an M.B.A. in Finance from Fordham University, where he graduated in 1987. He holds a Bachelor of Arts in Economics from George Washington University.
More Economy in Brief


